A Guide to Linux /proc Filesystem
Most Linux users know that /proc exists. Fewer actually use it. But /proc is one of the most useful diagnostic tools on your entire system, and it requires zero extra packages.
/proc is a virtual filesystem. Nothing in it is stored on disk. The kernel generates most of these files on the fly when you read them. Think of it as a live window into the kernel’s internal state: running processes, memory layout, CPU info, network statistics, hardware interrupts, and much more.
Once you start reading /proc directly, you’ll understand exactly where tools like top, free, vmstat, and ss pull their data from. You’ll also be able to extract information those tools don’t expose.
What /proc Actually Is
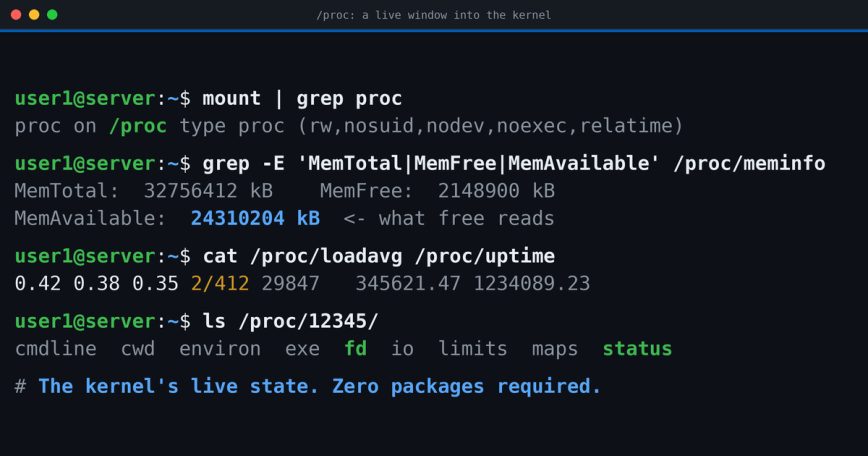
The kernel mounts /proc as a pseudo-filesystem of type procfs. It appears in your filesystem tree, but nothing is written to disk. Every read triggers a kernel function that assembles the data in real time.
You can confirm the mount type with:
mount | grep proc
proc on /proc type proc (rw,nosuid,nodev,noexec,relatime)
Two distinct things live under /proc. First, numbered directories like /proc/1234/, one for each running process, where the number is the PID. Second, system-wide files and directories like /proc/meminfo, /proc/cpuinfo, and /proc/net/ that expose kernel-wide state.
Everything here is readable with standard tools: cat, grep, less, awk, even a basic shell read call. Some files under /proc/sys/ are also writable, which is how sysctl works under the hood.
System-Wide Files You Should Know
/proc/cpuinfo
Everything the kernel knows about your CPU cores.
cat /proc/cpuinfo
Each logical CPU gets its own block. Useful fields:
model name– the CPU model string.cpu MHz– current clock speed (updates dynamically with frequency scaling).cache size– cache size as the architecture reports it. Cache topology on modern CPUs is complicated (caches are shared between cores in various ways), so don’t read this as one private cache per core.lscpuparses this same file and lays out sockets, cores, and threads more clearly.flags– CPU feature flags. Check forvmxorsvmfor virtualization support,aesfor hardware AES,avx2for AVX2 SIMD support.siblingsvscpu cores– if siblings is greater than cpu cores, SMT (hyperthreading) is active and logical CPUs are sharing physical cores.
Count logical CPUs quickly:
grep -c '^processor' /proc/cpuinfo
Check if AES hardware acceleration is present (useful before configuring encrypted VPNs or disk encryption):
grep -m1 'aes' /proc/cpuinfo
/proc/meminfo
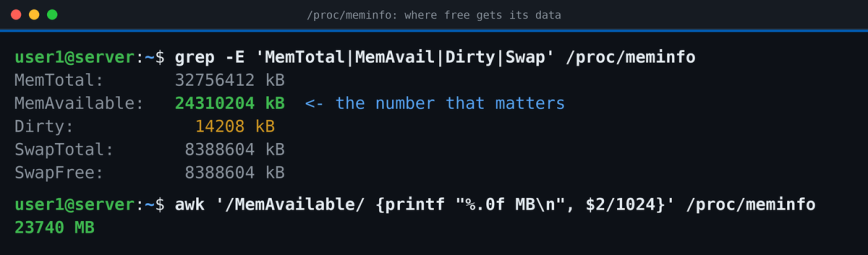
This is where free gets its data. Reading it directly gives you far more detail.
cat /proc/meminfo
Key fields to understand:
MemTotal– total usable RAM (slightly less than physical RAM due to kernel reservations).MemFree– completely unused memory. A low number here is not necessarily a problem.MemAvailable– kernel’s estimate of how much memory is actually available without swapping. This is the number that matters. See Linux server needs a RAM upgrade? for a deeper discussion on this, and free vs available memory in Linux for why the distinction matters.Buffers– memory used for kernel I/O buffers.Cached– page cache memory (file contents cached in RAM).SwapTotal/SwapFree– swap capacity and availability.Dirty– memory waiting to be written back to disk. High values here under sustained I/O workloads can cause latency spikes.Shmem– shared memory in use, including tmpfs allocations.HugePages_Total/HugePages_Free– huge page allocation status. Relevant for databases like MySQL or PostgreSQL.
Quick one-liner to show available memory in megabytes:
awk '/MemAvailable/ {printf "Available: %.0f MB\n", $2/1024}' /proc/meminfo
/proc/loadavg
cat /proc/loadavg
0.42 0.38 0.35 2/412 29847
The first three numbers are the 1, 5, and 15-minute load averages. The fourth field shows currently runnable tasks (scheduling entities) over total tasks. The last field is the most recently created PID. Simple, but often all you need for a quick sanity check in a script.
/proc/uptime
cat /proc/uptime
345621.47 1234089.23
Two values: seconds since boot, and total seconds all CPUs have spent idle. Useful in scripts where you want uptime without parsing the output of the uptime command.
/proc/stat
Raw CPU time counters, per CPU and aggregate. The top and vmstat commands derive their CPU percentages by sampling this file twice and calculating the delta.
cat /proc/stat | head -5
cpu  1234567 890 345678 98765432 12345 0 6789 0 0 0
cpu0 312345 223 86420 24691358 3086 0 1697 0 0 0
cpu1 308642 222 86419 24691358 3086 0 1697 0 0 0
Columns after cpu: user, nice, system, idle, iowait, irq, softirq, steal, guest, guest_nice. The iowait column is worth watching on I/O-heavy servers. Also see the iostat command guide for a more digestible view of the same data.
/proc/diskstats
Per-device I/O statistics. This is the source for iostat.
cat /proc/diskstats | grep ' sda '
The fields include reads/writes completed, sectors read/written, and time spent in I/O. Useful for raw scripted monitoring without needing sysstat installed.
/proc/net/
A directory full of network statistics. Some highlights:
/proc/net/dev– per-interface byte and packet counters. The classic source forifconfig, and handy for raw scripted interface stats. (Note:ip -s linkpulls its numbers over netlink, not by parsing this file.)/proc/net/tcpand/proc/net/tcp6– active TCP connections in a low-level hex format. Older tools likenetstatread these directly. Modernssuses the kernel’s netlink socket diagnostic interface instead, which is faster and less painful to parse./proc/net/sockstat– socket usage summary: how many TCP, UDP, and raw sockets are in use./proc/net/snmp– SNMP-style counters including retransmits, failed connections, and resets.
Check total socket usage at a glance:
cat /proc/net/sockstat
sockets: used 412
TCP: inuse 38 orphan 0 tw 4 alloc 41 mem 9
UDP: inuse 12 mem 4
...
Also see the netstat command guide if you prefer a parsed view of this data.
Per-Process Directories: /proc/PID/
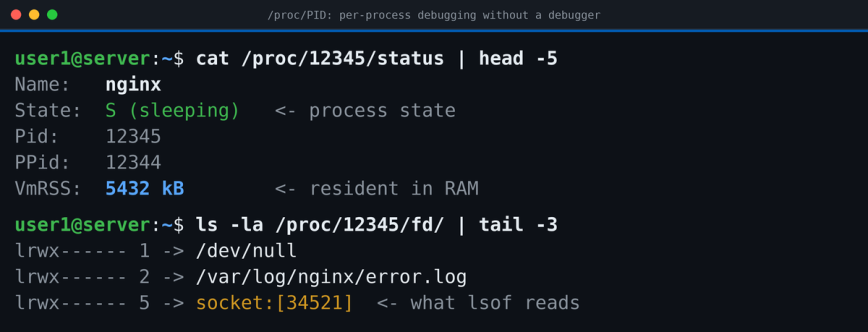
Every running process gets its own directory under /proc/ named by PID. These are invaluable for debugging individual processes without attaching a debugger.
Two shortcuts save you from looking up a PID at all. /proc/self always points at the process doing the reading, which is what makes it so useful inside scripts:
cat /proc/self/status
readlink /proc/self
And $$ is the current shell’s PID, so /proc/$$/ inspects the shell you’re typing in:
cat /proc/$$/status | grep -E 'Pid|PPid'
For everything else, find the PID of a process first:
pidof nginx
12345 12346 12347
For a service like nginx or Apache, the first PID is usually the master process (often running as root) and the rest are workers running as www-data or nginx. That ownership difference matters: it decides which files inside their /proc directories you can actually read without escalating.
Now look inside that process’s directory:
ls /proc/12345/
attr  cmdline  cwd  environ  exe  fd  fdinfo  io  limits  maps  mem
mounts  net  ns  oom_adj  oom_score  pagemap  smaps  stat  statm  status ...
/proc/PID/cmdline
The exact command used to launch the process, null-byte delimited. Useful when ps truncates long argument lists.
cat /proc/12345/cmdline | tr '\0' ' '
nginx: worker process
/proc/PID/status
A human-readable summary of the process: UID, GID, memory usage, thread count, and signal masks.
cat /proc/12345/status
Name:   nginx
State:  S (sleeping)
Pid:    12345
PPid:   12344
Threads: 1
VmRSS:  5432 kB
VmSwap: 0 kB
...
VmRSS is resident set size: how much of the process’s mapped memory is currently resident in RAM. Note that RSS can include pages shared with other processes, so it isn’t a clean per-process total. VmSwap tells you if this specific process has been pushed to swap. The State field maps directly to the process states covered in Linux process states explained.
/proc/PID/fd/
A directory of symlinks, one for each open file descriptor. This is the data source for lsof.
ls -la /proc/12345/fd/
lrwx------ 1 root root 64 Jan 10 09:22 0 -> /dev/null
lrwx------ 1 root root 64 Jan 10 09:22 1 -> /dev/null
lrwx------ 1 root root 64 Jan 10 09:22 2 -> /var/log/nginx/error.log
lrwx------ 1 root root 64 Jan 10 09:22 5 -> socket:[34521]
Count open file descriptors for a process:
ls /proc/12345/fd | wc -l
Compare that against the process limit in /proc/12345/limits to see if you’re approaching the open files ceiling. This matters for high-connection services like nginx or Redis.
/proc/PID/io
Disk I/O accounting for the process.
cat /proc/12345/io
rchar: 1234567
wchar: 890123
syscr: 12345
syscw: 6789
read_bytes: 4096000
write_bytes: 2048000
cancelled_write_bytes: 0
read_bytes and write_bytes track bytes actually passed to the storage layer, unlike rchar and wchar above them, which count bytes moved through read/write system calls (cache hits included). Good for identifying which process is actually hammering your disks when iotop isn’t available.
/proc/PID/maps and /proc/PID/smaps
maps shows every memory region mapped into the process: code, stack, heap, shared libraries, and memory-mapped files. smaps is the detailed version with per-region RSS, PSS, and swap usage. This is the data source for tools like smem.
grep 'libssl' /proc/12345/maps
7f3a1234b000-7f3a1235c000 r-xp 00000000 fd:01 123456  /usr/lib/x86_64-linux-gnu/libssl.so.3
/proc/PID/environ
The environment variables the process was launched with, null-byte delimited.
cat /proc/12345/environ | tr '\0' '\n' | grep PATH
Note: access is governed by Linux’s ptrace permission checks, so matching the target’s UID is not the only factor; capabilities, namespaces, and modules like Yama all play in. Also worth knowing: this reflects the environment supplied at exec time, not necessarily the process’s current environment if it changed variables after starting.
/proc/PID/cwd and /proc/PID/exe
Symlinks to the process’s current working directory and the actual executable on disk.
readlink /proc/12345/exe
/usr/sbin/nginx

readlink /proc/12345/cwd
/
This is how you identify the binary behind a process even if its cmdline has been modified, or if a process is running from a deleted file (common with in-place binary upgrades). Check for deleted executables with:
ls -la /proc/*/exe 2>/dev/null | grep deleted
/proc/PID/oom_score
The kernel’s out-of-memory killer scores every process so it knows what to kill first when memory runs out. /proc/PID/oom_score is the current score, and /proc/PID/oom_score_adj is the tunable bias (-1000 to 1000) you set to protect or sacrifice a process.
cat /proc/12345/oom_score
17

cat /proc/12345/oom_score_adj
0
Set oom_score_adj to -1000 to exclude a process from OOM killer selection entirely, or use a positive value to make a memory-hungry batch job much more likely to be picked first.
/proc Inside Containers
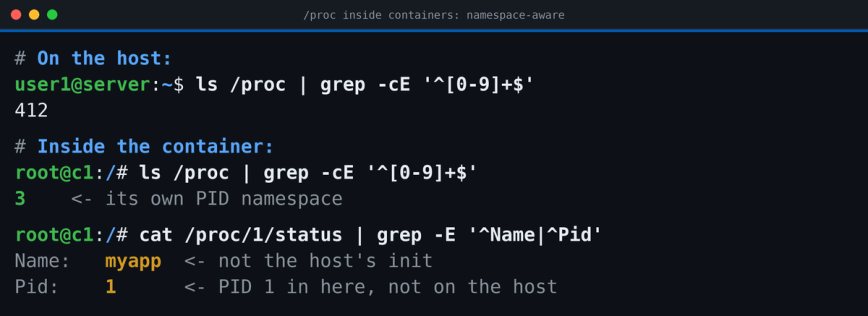
Here’s something that trips people up the first time. /proc is namespace-aware. When you’re inside a Docker container, procfs reflects that container’s PID namespace, not the host’s. So ls /proc inside a container shows only the processes the container can see, and PID 1 is the container’s entrypoint rather than the host’s init.
cat /proc/1/cgroup
cat /proc/1/status | grep -E 'Name|Pid'
ls /proc | grep -E '^[0-9]+$'
The practical upshot: don’t assume a PID you see inside a container maps to the same PID on the host. It doesn’t. The kernel translates PIDs across namespace boundaries, so the same process has one PID on the host and a different one inside the container. This is also why memory and CPU figures in /proc/meminfo and /proc/stat inside a container often show host totals, not the container’s limits. That mismatch is exactly why tools that predate cgroup-awareness misreport resources inside containers.
Writing to /proc/sys/ with sysctl
Files under /proc/sys/ are writable kernel tunables. This is exactly what sysctl reads and writes.
cat /proc/sys/vm/swappiness
60

echo 10 | sudo tee /proc/sys/vm/swappiness
That’s equivalent to sysctl -w vm.swappiness=10. Note the tee: if you write sudo echo 10 > /proc/sys/vm/swappiness instead, the redirect is opened by your shell before sudo escalates, so it fails with permission denied. Piping into sudo tee is the reliable pattern for every writable file under /proc. Changes are immediate but not persistent across reboots. To persist them, write to /etc/sysctl.conf or a file in /etc/sysctl.d/.
Some useful tunables you can inspect and adjust this way (the kernel’s own vm sysctl documentation describes each one in full):
/proc/sys/vm/swappiness– kernel swap tendency. The range is 0-200 (it was 0-100 on older kernels), default 60. Values above 100 make sense with fast swap backends like zram or zswap./proc/sys/vm/vfs_cache_pressure– how aggressively to reclaim cached directory/inode objects./proc/sys/net/ipv4/ip_forward– enable IP forwarding (required for routing, VPNs, Docker, etc.)./proc/sys/net/core/somaxconn– maximum value for the socketlisten()backlog. Modern kernels default to 4096. Raising it helps workloads with large connection bursts, but the application’s own backlog argument and TCP settings matter just as much./proc/sys/fs/file-max– system-wide open file descriptor limit./proc/sys/kernel/pid_max– the PID allocation wrap value. Older systems capped at 32768; modern systems commonly run far higher, so check yours rather than assuming.
Practical /proc Recipes
Here are a few one-liners I actually use.
Find which process has a specific port open (without ss or lsof). The socket inode lives in /proc/net/tcp*, and the same inode shows up as a socket:[inode] symlink under each process’s fd/ directory:
# Port to hex: 80 = 0050, 443 = 01BB. Column 10 is the inode.
inode=$(awk '$2 ~ /:01BB$/ {print $10; exit}' /proc/net/tcp6)
ls -l /proc/*/fd/ 2>/dev/null | grep "socket:\[$inode\]"
Check if a process is being CPU throttled by cgroups. The throttling stats live in the cgroup’s cpu.stat, not in /proc/PID/sched, so find the process’s cgroup first, then read it:
cat /proc/12345/cgroup
0::/system.slice/myservice.service

cat /sys/fs/cgroup/system.slice/myservice.service/cpu.stat | grep -E 'nr_throttled|throttled_usec'
A climbing nr_throttled means the process is hitting its CPU quota. The exact path under /sys/fs/cgroup depends on your cgroup hierarchy, which is why you read /proc/PID/cgroup first.
Find processes with open deleted files (memory leaks from log rotation or binary upgrades):
find /proc/*/fd -ls 2>/dev/null | grep '(deleted)'
Show real-time memory pressure on the system with watch:
watch -n1 'grep -E "MemAvailable|Dirty|Writeback|SwapFree" /proc/meminfo'
Get interrupt counts per CPU (useful for diagnosing IRQ affinity and network tuning):
cat /proc/interrupts | head -20
A Note on /proc vs. /sys
You’ll also encounter /sys, which is a separate virtual filesystem called sysfs. Where /proc is process-oriented and general-purpose, /sys is specifically structured around the kernel’s device model: drivers, buses, block devices, power management, and hardware topology.
For example, CPU frequency scaling lives in /sys/devices/system/cpu/cpu0/cpufreq/, not in /proc. Block device scheduler settings are in /sys/block/sda/queue/scheduler. They’re complementary. Learn both.
Summary
Once you get used to reading /proc directly, a lot of Linux performance and debugging work becomes cleaner. You stop depending on tools being installed. You can write faster, simpler monitoring scripts. And you understand exactly what the higher-level tools are doing under the hood. The kernel’s own proc documentation is the definitive reference when you need the exact meaning of a field.
The key files to bookmark: /proc/meminfo, /proc/cpuinfo, /proc/stat, /proc/net/dev, and the per-process directory structure under /proc/PID/. Start reading those regularly and the rest follows naturally.
Also see 90+ Linux Commands frequently used by Linux Sysadmins and the 60 Linux Networking commands and scripts guide for more tools that build on this foundation.