Linux perf Command: CPU Profiling and Performance Analysis
If your server feels slow but top and htop show nothing obvious, you need to go deeper. The perf command is the Linux performance analysis tool that most sysadmins never touch, and that’s a shame, because it can show you exactly what the CPU is doing at the instruction level.
I ignored perf for years. top, vmstat and iostat covered most of what I needed, and perf looked like a tool for kernel developers. That changed when [the server and the symptom]. Thirty seconds of perf record pointed straight at [what it found]. It has been in my toolbox ever since.
This guide walks through real-world usage of the perf command in Linux: profiling CPU usage, finding hot functions, tracing system calls, and interpreting the output without getting lost in theory.
What Is perf?
perf is a performance analysis tool that lives in the Linux kernel source tree and talks directly to the kernel’s perf_events subsystem. It uses hardware performance counters, software events, and tracepoints to measure what the system is doing. Unlike tools that sample at the process level, perf can profile down to individual functions and even CPU instructions.
Because it is developed alongside the kernel, distros build perf to match the kernels they ship. That matters because some features depend on kernel support.
Note: perf is different from general monitoring tools like htop or atop. Those tell you that CPU is high. perf tells you why.
Installing perf
On most distros, perf is not installed by default. Install it with your package manager:
Debian / Ubuntu:
sudo apt install linux-perf
On Ubuntu, the package is split by kernel version instead:
sudo apt install linux-tools-$(uname -r) linux-tools-generic
Fedora / RHEL / CentOS:
sudo dnf install perf
Arch Linux:
sudo pacman -S perf
After installing, confirm it works:
perf --version
You should see something like perf version 6.x.x. If the version does not match your kernel, you may get warnings. On Ubuntu especially, make sure you install the package matching uname -r.
Basic Usage: What Can perf Do?
Run perf with no arguments to see the available subcommands:
perf
The most useful ones for day-to-day performance work:
perf stat: Count hardware and software events for a command or processperf top: Live view of hottest functions system-wide, liketopbut for CPU cyclesperf record: Record profiling data to a fileperf report: Analyze recorded data interactivelyperf list: List all available eventsperf trace: Trace system calls (similar tostracebut lower overhead)
perf stat: Count Events for a Command
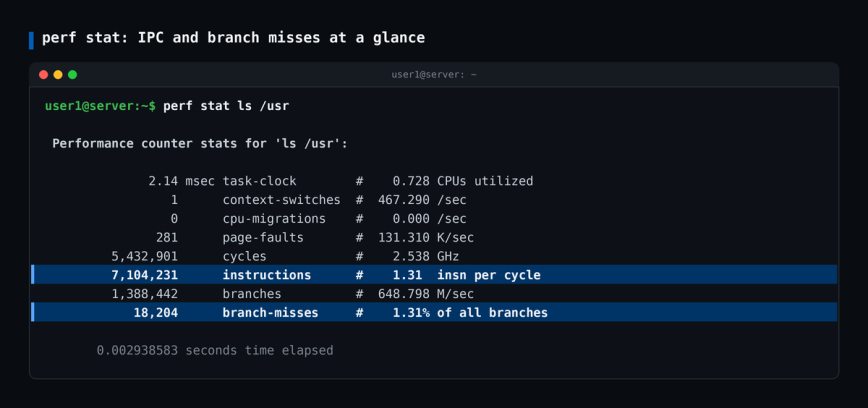
perf stat runs a command and prints performance counters when it finishes. It is the quickest way to get a feel for what a process is doing at the hardware level.
perf stat ls /usr
Output looks something like this:
 Performance counter stats for 'ls /usr':

              2.14 msec task-clock                #    0.728 CPUs utilized
                 1      context-switches          #  467.290 /sec
                 0      cpu-migrations            #    0.000 /sec
               281      page-faults               #  131.310 K/sec
         5,432,901      cycles                    #    2.538 GHz
         7,104,231      instructions              #    1.31  insn per cycle
         1,388,442      branches                  #  648.798 M/sec
            18,204      branch-misses             #    1.31% of all branches

       0.002938583 seconds time elapsed
       0.001778000 seconds user
       0.001133000 seconds sys
The key numbers to read here:
- Instructions per cycle (IPC): Higher is better. Low IPC often means cache misses or stalls.
- Branch misses: A high percentage can indicate the CPU is struggling to predict code paths.
- Page faults: Unusually high counts may point to memory pressure.
- Task-clock vs CPUs utilized: Less than 1.0 CPUs utilized means the process spent time waiting rather than computing.
You can also attach perf stat to a running process by PID:
sudo perf stat -p 1234 sleep 10
This samples PID 1234 for 10 seconds, then prints stats. Useful for profiling a running web server or database without restarting it.
Counting Specific Events
Use -e to specify events. See available events with perf list:
perf list | grep cache
Then count cache misses for a command:
perf stat -e cache-references,cache-misses,cpu-cycles myapp
A high ratio of cache misses to cache references means your application is memory-access bound, not compute bound. Faster CPUs will not help much there. Better data locality will.
perf top: Live CPU Hotspot View
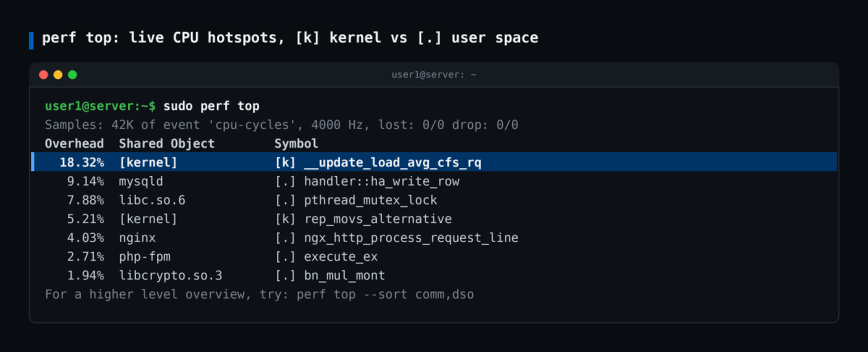
perf top shows a live, updating view of the functions consuming the most CPU cycles across the whole system. Think of it as top for functions, not processes.
sudo perf top
You will see output like this:
Samples: 42K of event 'cpu-cycles', 4000 Hz, lost: 0/0 drop: 0/0
Overhead  Shared Object        Symbol
  18.32%  [kernel]             [k] __update_load_avg_cfs_rq
   9.14%  mysqld               [.] handler::ha_write_row
   7.88%  libc.so.6            [.] pthread_mutex_lock
   5.21%  [kernel]             [k] rep_movs_alternative
   4.03%  nginx                [.] ngx_http_process_request_line
The Overhead column is the percentage of CPU samples attributed to that function. The [k] marker means kernel space and [.] means user space. Kernel functions show [kernel] as their shared object. Everything else shows the library or binary it belongs to.
If you see a function you do not recognize, highlight it and press a to annotate the source or assembly. This requires debug symbols to be useful, but even without them, the call location gives you a starting point.
Limit to a specific process:
sudo perf top -p 1234
Or a specific CPU core:
sudo perf top --cpu 0,1
perf record and perf report: Deep Profiling
For anything serious, you want to record a profile and then analyze it. This is the standard workflow.
Step 1: Record
Profile system-wide for 30 seconds:
sudo perf record -g -a sleep 30
-g: Capture call graphs (stack traces). This is what makes the output readable.-a: Profile all CPUs, not just the current process.sleep 30: The recording runs for 30 seconds.
Profile a specific process:
sudo perf record -g -p 1234 sleep 30
Profile a specific command from start to finish:
sudo perf record -g ./myapp --options
This creates a perf.data file in the current directory. By default, perf record samples at around 4000 Hz. On a busy production box, add -F 99 to cut overhead and file size. The odd number is deliberate. It keeps samples from landing in lockstep with timers that fire at round rates like 100 Hz or 1000 Hz, which would skew the profile.
Step 2: Report
sudo perf report
This opens an interactive TUI. You can navigate with arrow keys, press Enter to expand a symbol, and a to annotate assembly. Press q to quit.
For a text dump instead:
sudo perf report --stdio | head -60
Output looks like:
# Overhead  Command  Shared Object       Symbol
# ........  .......  ..................  ...............................
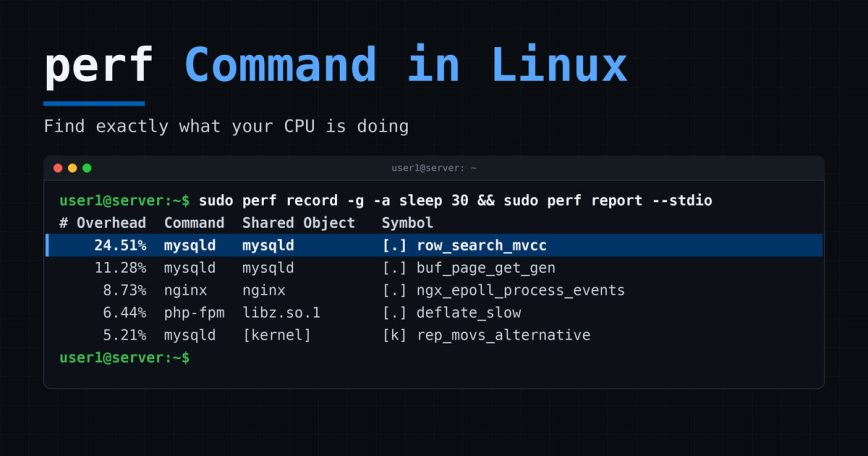
    24.51%  mysqld   mysqld              [.] row_search_mvcc
    11.28%  mysqld   mysqld              [.] buf_page_get_gen
     8.73%  nginx    nginx               [.] ngx_epoll_process_events
     6.44%  php-fpm  libz.so.1.2.11      [.] deflate_slow
In this example, MySQL’s row_search_mvcc is eating nearly a quarter of CPU time. You would then look at slow query logs, missing indexes, or buffer pool sizing. Without perf, you would just see “mysqld is using CPU” and guess from there.
Reading Call Graphs
With -g enabled, you can expand symbols in the TUI to see the full call chain. This shows you not just which function is hot, but what called it. That context is often more useful than the function name alone.
For a flat call-graph text output:
sudo perf report --stdio --call-graph flat | head -80
If call chains look broken or end in [unknown], the binary was probably built without frame pointers. Ubuntu 24.04 and Fedora 38 and later build their packages with frame pointers, so -g works out of the box there. On other distros, switch to DWARF unwinding:
sudo perf record --call-graph dwarf -p 1234 sleep 30
DWARF mode writes much larger perf.data files, so keep these recordings short.
perf trace: Low-Overhead Syscall Tracing
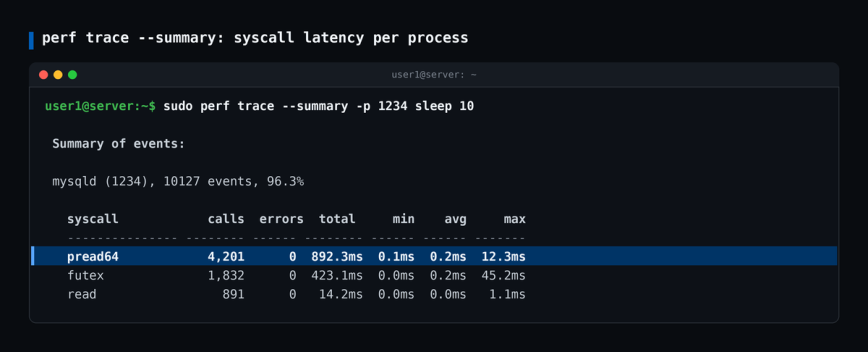
perf trace is similar to strace but with significantly lower overhead. It is suitable for production systems where strace would slow things down too much.
Trace a running process:
sudo perf trace -p 1234
Trace only specific syscalls:
sudo perf trace -e openat,read,write -p 1234
Summarize syscall counts instead of streaming output:
sudo perf trace --summary -p 1234 sleep 10
Output:
             Summary of events:

 mysqld (1234), 10127 events, 96.3%

   syscall            calls  errors  total       min       avg       max
   --------------- -------- ------ -------- --------- --------- ---------
   pread64            4,201      0  892.3ms    0.1ms    0.2ms    12.3ms
   futex              1,832      0  423.1ms    0.0ms    0.2ms    45.2ms
   read                 891      0   14.2ms    0.0ms    0.0ms     1.1ms
That pread64 with a 12ms max latency on a database process is worth investigating. It could mean slow disk I/O, a cold buffer pool, or missing indexes causing full table scans.
perf list: Available Events
perf can measure a wide range of events beyond CPU cycles. List them all:
perf list
Filter by category:
perf list | grep -i cache
perf list | grep -i net
perf list | grep -i block
Some common useful events:
cache-misses: LLC (last-level cache) missespage-faults: Memory page faultscontext-switches: How often the kernel is switching between processescpu-migrations: Processes jumping between CPU coresblock:block_rq_issue: Block device I/O requests issuednet:net_dev_xmit: Network transmit events
Note: Hardware events like cache-misses require PMU (Performance Monitoring Unit) support. On VMs or some cloud instances, these may not be available. Check before you start. If dmesg | grep -i pmu mentions software events only, or perf stat -e cycles true prints <not supported>, the hypervisor is hiding the PMU. Software events like context-switches and page-faults work everywhere.
Flame Graphs: The Best Way to Read perf Data
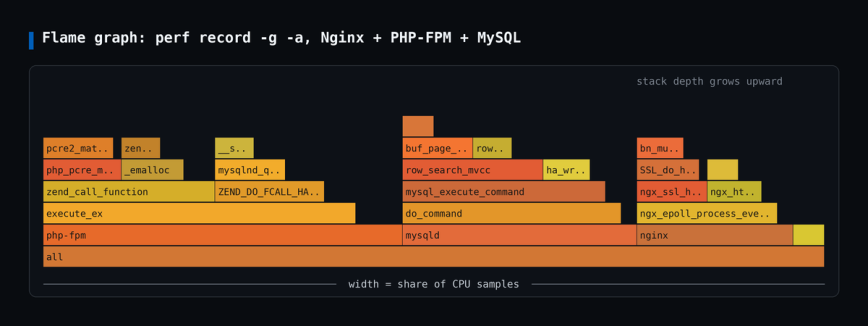
Interactive TUI reports are fine, but flame graphs are far easier to read at a glance, especially when sharing findings with a team.
The standard tool is Brendan Gregg’s FlameGraph scripts. Here is the full workflow:
git clone https://github.com/brendangregg/FlameGraph
sudo perf record -g -a sleep 30
sudo perf script | ./FlameGraph/stackcollapse-perf.pl | ./FlameGraph/flamegraph.pl > flamegraph.svg
Open flamegraph.svg in a browser.
Newer perf builds (kernel 5.8 and later) can skip the Perl scripts entirely. Run perf script report flamegraph in the same directory as perf.data and it writes an interactive flamegraph.html. It needs the d3-flame-graph template, which some distros package and others download on first run. On a desktop, hotspot opens perf.data in a GUI with flame graphs built in.
In either view, the width of each box represents how much CPU time that function consumed. Tall stacks show deep call chains. Wide boxes at the top are your bottlenecks.
This helps most with slow web applications. If you see a wide box under your PHP or Python interpreter, you know the problem is in application code. If you see wide boxes in kernel I/O functions, the CPU is burning time in the storage or network stack, not in your code.
Practical Example: Diagnosing a Slow Web Server
This is the same workflow I use on my own Nginx and PHP-FPM servers. Say yours is slow under load, and top shows high CPU but nothing obvious. Here is what I do:
1. Record a profile under load:
sudo perf record -g -a sleep 60
While that runs, hit the server with traffic using ab or wrk.
2. Check the report:
sudo perf report --stdio | head -40
3. If you see Nginx functions dominating: Check worker connections, keepalive_timeout, and how much time goes to TLS. Heavy libcrypto or libssl symbols usually mean too many full handshakes, so confirm session resumption is enabled.
4. If you see PHP functions dominating: Look at which functions are hot. execute_ex being very high means time in user PHP code. _emalloc or zend_mm_alloc_* being high suggests excessive memory allocation, possibly from large arrays or object churn. Cross-reference with performance monitoring commands to confirm where pressure is coming from.
5. If you see kernel I/O functions dominating: The CPU is spending its time in the filesystem or block layer, often from a flood of small reads and writes. Batch the I/O, add caching, or fix the queries behind it if a database is involved.
One catch: perf record only samples code that is running on a CPU. Time spent blocked on disk does not show up at all. If the server is slow but CPU usage is low, check iowait and iostat first.
Permissions and Kernel Settings
perf requires elevated privileges for most useful operations. By default, unprivileged users can only profile their own processes and only with limited event sets.
Check the current paranoia level:
cat /proc/sys/kernel/perf_event_paranoid
Values and what they allow:
-1: Almost all events are open to all users.0: Unprivileged users lose raw and ftrace function tracepoints.1: Unprivileged users also lose system-wide CPU events.2: Upstream kernel default. Unprivileged users also lose kernel profiling, so they can only profile user space in their own processes.3and above: Added by Debian and Ubuntu kernel patches. Blocks unprivileged users fromperfentirely. Debian defaults to 3, and recent Ubuntu releases default to 4.
Root, or any user with CAP_PERFMON, is not affected by this setting. Running perf with sudo works at every level.
Containers share the host kernel, so the easiest way to profile a containerized app is from the host. Find the process ID with docker top or ps, then run sudo perf top -p PID or sudo perf record -g -p PID as usual. Running perf inside the container usually fails, because Docker’s default seccomp profile blocks perf_event_open unless the container has CAP_PERFMON or CAP_SYS_ADMIN.
To let non-root users profile temporarily:
sudo sysctl -w kernel.perf_event_paranoid=1
To make it permanent, drop it into a file under /etc/sysctl.d/:
echo 'kernel.perf_event_paranoid=1' | sudo tee /etc/sysctl.d/99-perf.conf
Note: On production systems, restore the original value after you are done profiling. Leaving paranoia at -1 or 0 permanently is a security risk.
You also need debug symbols to get meaningful function names. Without them, stripped binaries show raw hex addresses. Install them for the packages you care about:
Ubuntu/Debian: enable the debug symbol repository first (ddebs on Ubuntu, debian-debug on Debian). Package names end in -dbgsym and follow the binary package name:
sudo apt install php8.3-fpm-dbgsym
Fedora/RHEL:
sudo dnf debuginfo-install nginx php-fpm
Recent perf builds can also fetch symbols on demand from debuginfod servers, which Ubuntu, Debian and Fedora all run.
Kernel function names come from /proc/kallsyms, so perf run as root shows them without extra packages. You only need the kernel debug package to annotate kernel source lines:
sudo apt install linux-image-$(uname -r)-dbg      # Debian
sudo apt install linux-image-$(uname -r)-dbgsym   # Ubuntu (ddebs repo)
sudo dnf debuginfo-install kernel                 # Fedora/RHEL
Quick Reference
perf stat command: Count hardware events for a commandsudo perf stat -p PID sleep 10: Count events for a running processsudo perf top: Live hotspot viewsudo perf top -p PID: Live hotspot view for one processsudo perf record -g -a sleep 30: Record system-wide profile with call graphssudo perf report: Analyze recorded datasudo perf trace -p PID: Trace syscalls for a processsudo perf trace --summary -p PID sleep 10: Summarize syscall countsperf list: List available events
Conclusion
perf fills a gap the usual monitoring tools leave open. When standard troubleshooting steps do not explain why your server is slow, the perf command is usually the next tool to reach for. It takes some getting used to. The core loop is short, though: perf record, then perf report, and a flame graph when you want the visual.
Always use -g. I learned that one the hard way: [my first profiles were flat lists of function names that told me almost nothing]. Without call graphs, you know which function is hot but not what called it. With them, you can trace the problem back to application code or a specific kernel path.
Start with perf stat on commands you run every day. You will learn a lot about how your software uses the CPU. Then move to perf top and perf record when something needs a deeper look.