Linux Server Health Checks: 10 Metrics Every Sysadmin Should Monitor
Servers give you warnings before they fail. Most sysadmins performing Linux server monitoring miss them because they’re watching the wrong numbers.
The metrics that actually matter are one level deeper: iowait instead of CPU percentage, active swap paging instead of memory usage, inode counts instead of just disk space. If you’re not tracking them, you’re guessing until something breaks.
Quick reference: metric thresholds at a glance
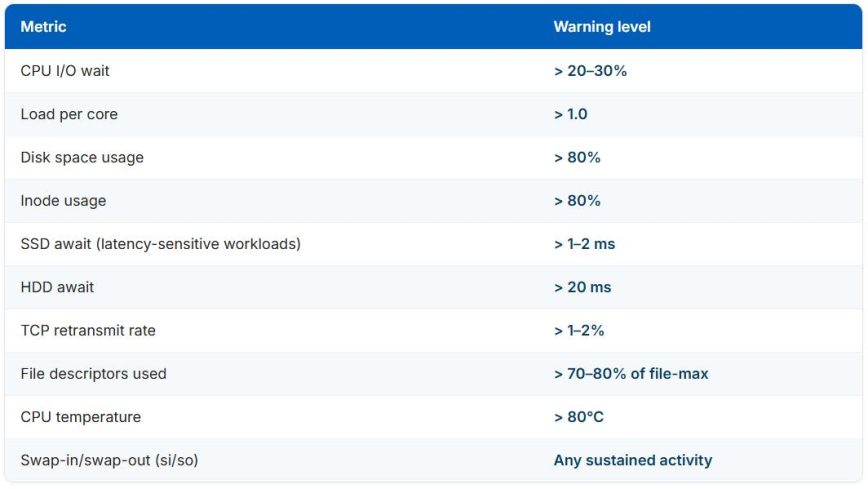
In this blog, we’ll discuss 10 metrics worth monitoring, explore what to look for, and cover what to do when something seems unusual.
1. CPU utilization (and the one number most people ignore)
Overall CPU usage is a starting point, but %iowait is where the real signal hides. High iowait means CPUs are spending significant time waiting for disk I/O operations rather than executing application workloads. A server at 90% CPU is busy; a server at 40% iowait is struggling.
mpstat -P ALL 1 5
What to watch for: Sustained iowait above 20–30% warrants a disk or storage investigation. Use iostat -xz 1 to follow up.
2. Load average vs. CPU core count
Load average is one of the most misread metrics in Linux performance monitoring. A load of 8.0 means nothing without knowing how many CPU cores you have.
A rule of thumb is that anything consistently above 1.0 per core suggests the system may be resource constrained, though the bottleneck could be CPU, disk I/O, or another subsystem.
cat /proc/loadavg
nproc
What to watch for: cat /proc/loadavg gives you 1-, 5-, and 15-minute averages. If the value is trending upward over 15 minutes, something is building up: a runaway process, thread leak, or I/O bottleneck.
3. Memory usage: don’t fear “used” RAM, fear active swapping
Linux uses free RAM for page caching, so a server showing 95% memory used isn’t necessarily in trouble if much of that is reclaimable cache. What matters is how much is actually available and whether the system is actively paging to swap.
free -h
grep -E "MemAvailable|SwapTotal|SwapFree" /proc/meminfo
Small amounts of swap usage aren’t necessarily a problem. Linux kernels with vm.swappiness tuning can move cold pages to swap proactively without any performance impact. What matters is active swapping: sustained swap-in and swap-out activity under load.
vmstat 1 5
What to watch for: The si (swap-in) and so (swap-out) columns in vmstat output. Any sustained non-zero values here, or swap usage that grows under load, indicate memory pressure that will degrade performance.
4. Disk space and inode usage
Running out of disk space is obvious. Running out of inodes is the silent killer that stumps even experienced admins. You can have gigabytes of free space and still be unable to create new files if all inodes are exhausted.
df -h        # disk space
df -i        # inode usage
What to watch for: Inode exhaustion often happens in directories with millions of small files, such as mail queues, session stores, and temp directories. Set alerts at 80% for both space and inodes with df, not just space.
5. Disk I/O latency and throughput
Throughput tells you how much data is moving. Latency tells you how long each operation takes. A disk serving sequential writes might have great throughput but terrible latency for random reads, which is exactly the pattern that kills database performance.
iostat -xz 1
Key columns to focus on:
await: average time (ms) for I/O requests to be served%util: percentage of time the device was busyr/s,w/s: read/write operations per second
What to watch for: await above 20 ms for HDDs or above 1–2 ms for latency-sensitive SSD workloads is worth investigating. On HDDs and SATA SSDs, %util near 100% usually indicates the disk is saturated. For NVMe SSDs, however, %util is less reliable due to their multi-queue architecture, so await from iostat is the better indicator of storage performance.
6. Network traffic and error rates
Bandwidth utilization is table stakes. What most dashboards miss are packet drops, errors, and retransmits, which can indicate NIC issues, switch problems, or a network that’s being flooded.
ip -s link show eth0
ss -s
netstat -s | grep -E "retransmit|error|drop"
What to watch for: A non-zero and growing error count on a NIC interface from ip points to a hardware or cabling problem. TCP retransmit rates above 1–2% from ss often indicate network congestion, packet loss, or other connectivity issues affecting application performance.
7. Open file descriptors
Every open file, socket, and pipe consumes a file descriptor. Applications under load, including web servers, databases, and messaging systems, can exhaust the per-process or system-wide limit and start throwing too many open files errors that cascade into outages.
# System-wide current usage
cat /proc/sys/fs/file-nr

# System-wide maximum
cat /proc/sys/fs/file-max

# Per-process
ls /proc/<PID>/fd | wc -l

# Per-process limits
cat /proc/<PID>/limits | grep "open files"
What to watch for: Compare current usage from the first value of the file-nr output against the system-wide maximum (file-max). Consistently exceeding 70–80% of file-max warrants investigation. If a specific process is approaching its ulimit, it either has a descriptor leak or needs its limit raised. To identify which process holds those descriptors, lsof maps open files back to their owning processes. The former is a bug; the latter is a tuning problem.
8. Process and thread counts
Sudden spikes in process count can indicate fork bombs, runaway cron jobs, or misconfigured application thread pools. On heavily threaded applications, thread count growth without bound is a classic symptom of a concurrency bug.
ps aux | wc -l
cat /proc/sys/kernel/threads-max
top -H -p <PID>   # threads for a specific process
What to watch for: Know your baseline. If a web server normally runs 50 worker processes and you suddenly see 500, something is wrong with the server or application configuration.
9. System temperature and hardware health
This one rarely makes it into software monitoring stacks, and it should. CPUs thermal-throttle before they shut down, and you’ll see mysterious performance degradation before any explicit error appears.
On virtual machines, hardware health may be hidden from the guest OS. On bare-metal servers, temperature and SMART data provide an additional layer of early warning that no software metric can substitute for.
# Requires lm-sensors
sensors

# Drives
smartctl -a /dev/sda

# IPMI (on bare metal with IPMI support)
ipmitool sdr type Temperature
What to watch for: CPU temperatures consistently above 80°C, or any drive reporting reallocated sectors, media errors, or uncorrectable errors in its SMART or NVMe health data, need immediate attention. Reading sensor output requires the lm-sensors package, and IPMI data on bare metal comes from ipmitool.
10. System log error rate
Metrics tell you what the numbers look like. Logs tell you why. Tracking the rate of ERROR and CRITICAL entries over time, rather than reading them line by line, gives you an early warning signal that something is degrading before it becomes an outage.
On servers running systemd, journalctl is the primary log source:
journalctl -p err --since "1 hour ago"
journalctl -p err --since "1 hour ago" | wc -l
On servers using syslog:
grep -iEc "error|critical" /var/log/syslog
What to watch for: A sudden increase in error log rate, even if the system appears to be running, often precedes a failure by minutes or hours. Baselining normal error rates makes anomalies obvious.
Putting it together: baselines beat thresholds
Static alert thresholds (such as alerting if the CPU exceeds 80%) are a start, but they’re blunt instruments. The most effective Linux server monitoring practice is establishing baselines for your specific workload and alerting on deviation from normal, not just absolute values.
A few principles worth internalizing:
- Correlate metrics, don’t silo them: High CPU combined with high iowait and elevated disk await tells a cleaner story than any one metric alone.
- Alert on trends, not snapshots: A 15-minute rising trend in load average is more actionable than a single spike.
- Monitor the monitoring gap: The time between a metric crossing a threshold and someone acting on it is where incidents grow. Automate what you can.
Running these checks manually works at small scale. As your infrastructure grows, doing Linux performance monitoring across dozens or hundreds of servers from the command line stops being practical. That’s where a unified platform makes a real difference.
OpManager Nexus is a full-stack observability platform that brings Linux server observability to your infrastructure with built-in dashboards, threshold-based alerting, trend analysis, and AI-driven root cause correlation.
The metrics above should be visible, baselined, and alerting in every production Linux environment. The tools change; the fundamentals don’t.