What is observability?
Leading software vendors have completed the expansion from traditional monitoring to full observability. However, there’s still a knowledge gap for customers interested in observability. As a result, some are left feeling a bit cloudy about observability for the cloud. Hopefully, this article will help add clarity to this topic.
What is observability? Explained
So, observability means what exactly? Let’s start with the official definition. As defined by Wikipedia: “Observability is a measure of how well the internal states of a system can be inferred from knowledge of its external outputs.”
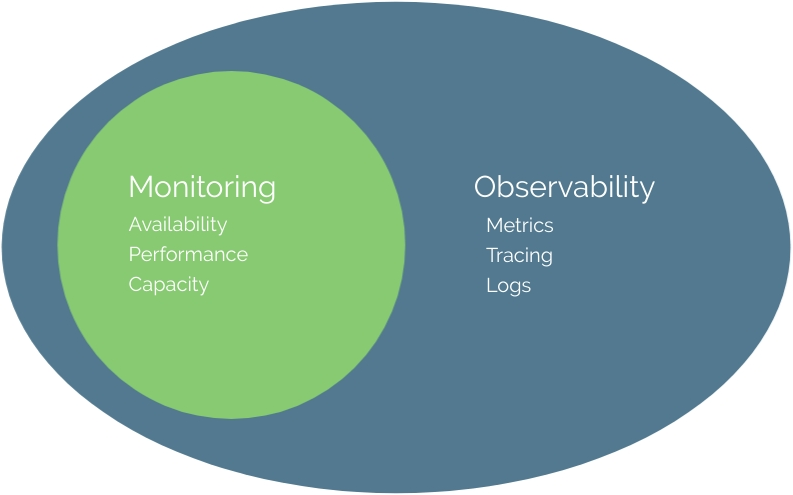
We’re already familiar with traditional monitoring. So, observability is simply a superset of monitoring. All elements of monitoring are also elements of observability. See the below diagram. The term observability has been defined and applied to cloud computing to achieve actionable insights using full-fidelity data.

Well-performing applications are critical to the growth of many online businesses and organizations, which require observability backed by traditional monitoring methods.
Monitoring is necessary to have observability into the inner workings of your systems. Observability adds additional insight using Metrics, Tracing, and Logging.
Observability Metrics, Tracing, and Logging (Telemetry)

Diagram by Peter Bourgon.
Let’s look at the significance of metrics, tracing, and logging as described in the book Distributed Systems Observability by Cindy Sridharan:
- Metrics – These are a numeric representation of data measured over time intervals. Metrics can harness the power of mathematical modeling and prediction to derive knowledge of the behavior of a system over intervals of time in the present and future. Since numbers are optimized for storage, processing, compression, and retrieval, metrics enable longer retention of data and easier querying. This factor makes metrics perfectly suited to building dashboards that reflect historical trends. Metrics also allow for a gradual reduction of data resolution. After a certain period of time, data can be aggregated into daily or weekly frequencies.
- Tracing – This represents a series of causally related distributed events that encode the end-to-end request flow through a distributed system. Traces are a representation of logs; the data structure of traces looks almost like that of an event log. A single trace can provide visibility into both the path traversed by a request and the structure of a request. The path of a request allows software engineers and SREs to understand the different services involved in the path of a request, and the structure of a request helps one understand the junctures and effects of asynchrony in the execution of a request.
- Logging – Logs are immutable, time-stamped records of discrete events that happened over time—essentially a timestamp and a payload with the context of each event.
Conclusion
In just a little over a year, we’ve covered the future of APM (application performance monitoring) and the expansion of APM into observability. Followed by the race between software vendors to define observability.
Most recently, we looked at the evolution of observability as shared by industry-leading software vendors. In this article, we defined observability. Also, see my vendor-neutral list of the current leaders in observability.
