Observability in 5 minutes. Plus, 20 observability software vendors
Previously we’ve covered the future of APM (application performance monitoring) and the expansion of APM into observability. Followed by the race between software vendors to define observability. Most recently, we looked at the evolution of observability as shared by industry-leading software vendors.
This article will answer the following questions to bring clarity to the topic of observability:
- What is observability?
- What is the difference between observability and monitoring?
- What are the best observability software and tools available?
- How is OpenTelemetry standardizing observability?
- What about security observability?
Leading software vendors have completed the expansion from traditional monitoring to full observability. However, there’s still a knowledge gap for customers interested in observability. As a result, some are left feeling a bit cloudy about observability for the cloud – no pun intended.
Let’s first go back and see what observability is and then how it fits with traditional monitoring practices.
What is Observability?

Observability Definition
Let’s start with the official definition. As defined by Wikipedia: “Observability is a measure of how well the internal states of a system can be inferred from knowledge of its external outputs.”
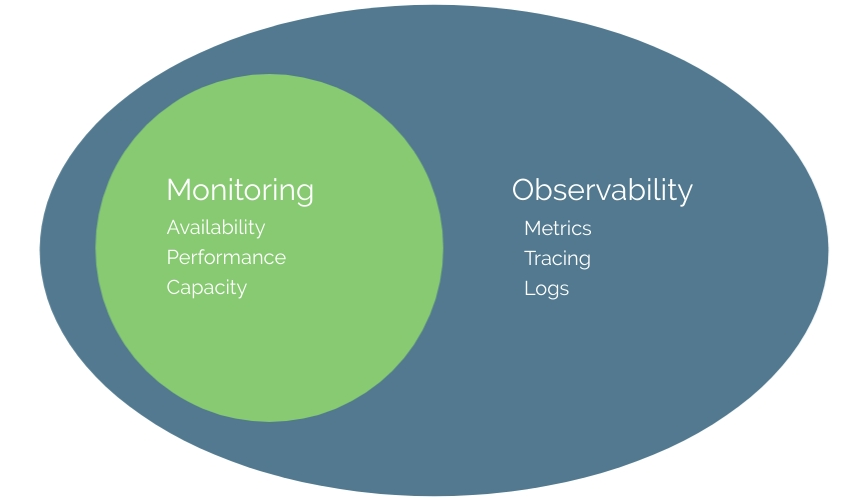
Observability is a superset of monitoring.
You cannot have observability without monitoring.
We’re already familiar with traditional monitoring. So, observability is simply a superset of monitoring. All elements of monitoring are also elements of observability. See the above diagram. The term observability has been defined and applied to cloud computing to achieve actionable insights using full-fidelity data.
Why Is Observability Important?
Well-performing applications are critical to the growth of many online businesses and organizations, which require observability backed by traditional monitoring methods.
Monitoring is necessary to have observability into the inner workings of your systems. Observability adds additional insight using Metrics, Tracing, and Logging.
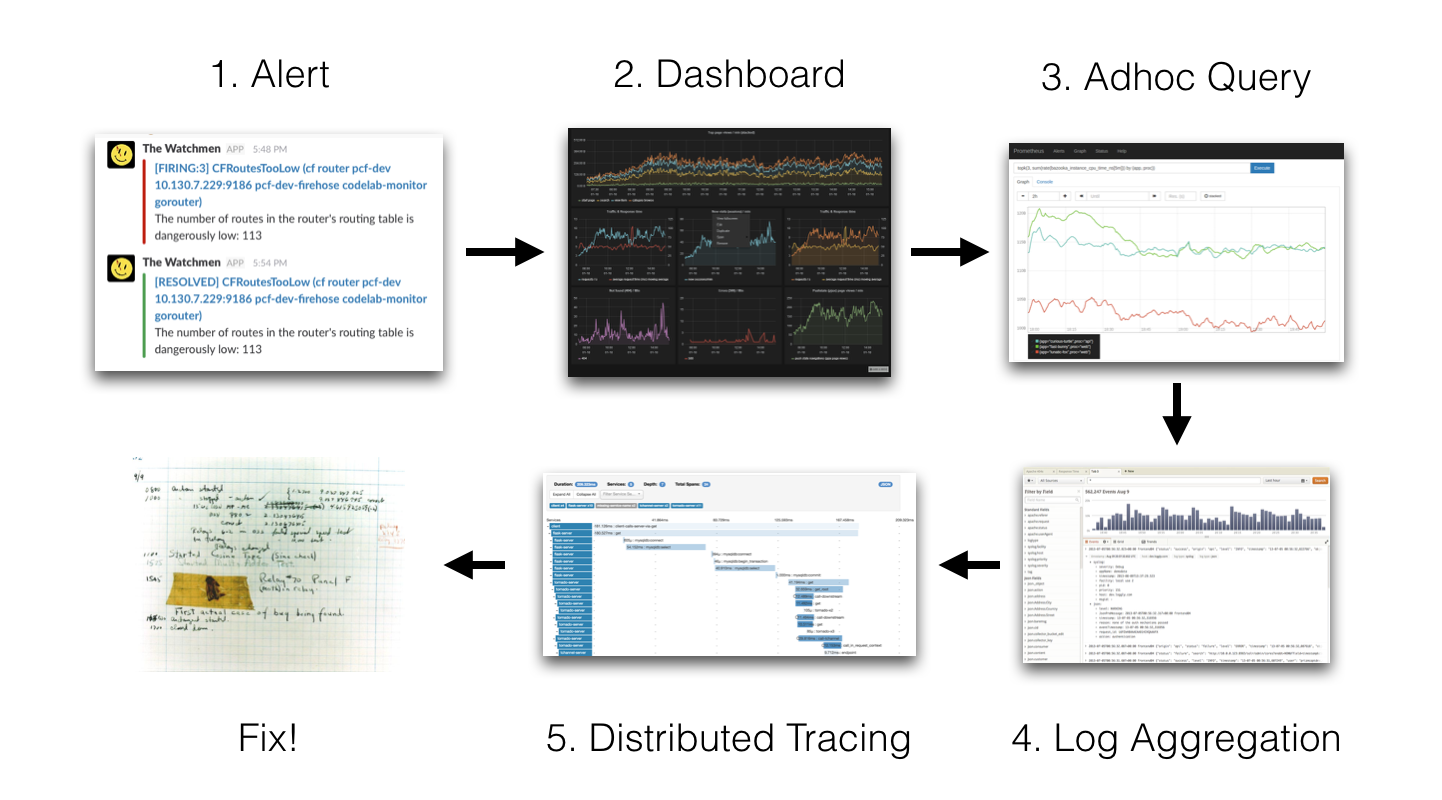
Observability Metrics, Tracing, and Logging (Telemetry)

Diagram by Peter Bourgon.
Let’s look at the significance of metrics, tracing, and logging as described in the book Distributed Systems Observability by Cindy Sridharan:
- Metrics – These are a numeric representation of data measured over intervals of time. Metrics can harness the power of mathematical modeling and prediction to derive knowledge of the behavior of a system over intervals of time in the present and future. Since numbers are optimized for storage, processing, compression, and retrieval, metrics enable longer retention of data and easier querying. This factor makes metrics perfectly suited to building dashboards that reflect historical trends. Metrics also allow for a gradual reduction of data resolution. After a certain period of time, data can be aggregated into daily or weekly frequencies.
- Tracing – This represents a series of causally related distributed events that encode the end-to-end request flow through a distributed system. Traces are a representation of logs; the data structure of traces looks almost like that of an event log. A single trace can provide visibility into both the path traversed by a request and the structure of a request. The path of a request allows software engineers and SREs to understand the different services involved in the path of a request, and the structure of a request helps one understand the junctures and effects of asynchrony in the execution of a request.
- Logging – Logs are immutable, time-stamped records of discrete events that happened over time—essentially a timestamp and a payload with the context of each event.
Observability Context
Observability provides valuable information about your applications, but information without context is often of little to no use. So when determining the health of applications, observability platforms must assist in putting things in context.
Therefore, observability platforms are required to digest raw data, then extract and present critical pieces of information in context. This need is why observability is a proactive process that goes beyond simple alerting. It tells you why something went wrong and provides enough context so you can fix it.
What is the Difference Between Observability and Monitoring?

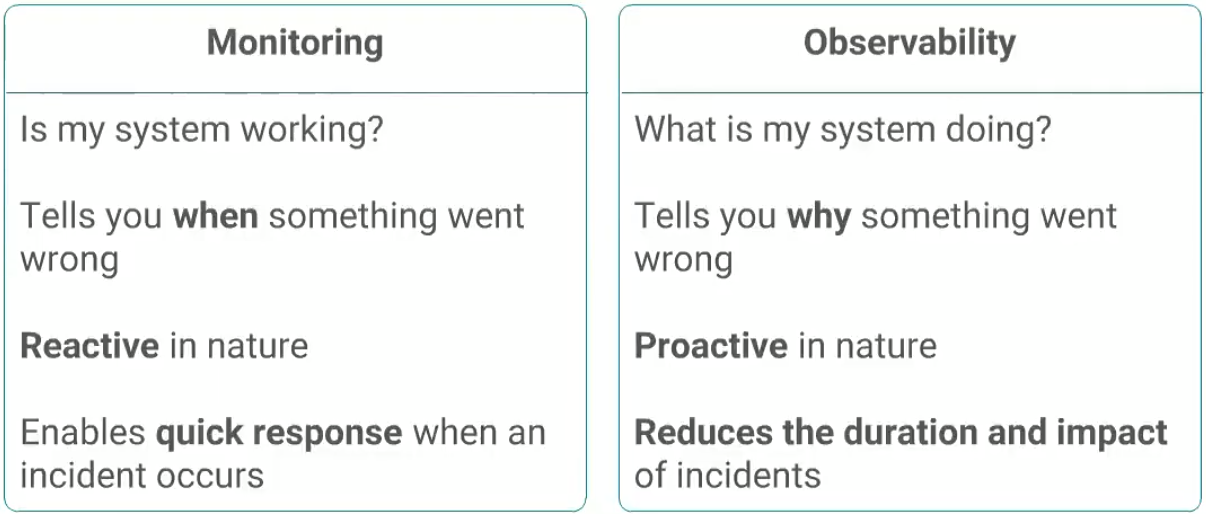
Monitoring vs. Observability side-by-side by Pepperdata.
Observability and monitoring may seem like the same thing, or at least very similar. When deployed, the two work together collectively. However, they are not the same.
Observability goes beyond simply monitoring the state of application availability, performance, or capacity to help you solve issues quickly. As I mentioned, it dives deeper by collecting and analyzing full-fidelity data in real-time to provide an interactive and detailed context of what’s happening, why, and how to resolve it.
What are the Best Observability Software and Tools Available?

Observability provides alerting, metrics overview, query tracing, and log analysis. – Grafana Labs
20 observability software vendors and tools that I recommend (in alphabetical order)
The observability software vendors pushing to allow more 3rd party integrations, open-source support, and open standards are best positioned to emerge as leaders in this market in 2021 and beyond.
Here is my vendor-neutral list of the current leaders in observability.
Last updated: March 24th, 2025
Appdynamics – Full-stack observability to drive business decisions.(Acquired by Cisco)Aternity – Digital Experience Management, and more.(Acquired by Riverbed)- Better Stack – Incident management meets observability.
- Broadcom – AIOps and Observability.
- Datadog – Modern Monitoring & Security for the Cloud Age.
- Dynatrace – Automatic and intelligent observability.
- Elastic – Unified visibility across your entire ecosystem.
Epsagon – Modern Observability for Modern Applications.(Acquired by Cisco)- Grafana – observability platform, integrating metrics, traces, and logs.
- Honeycomb – Observability for modern engineering and DevOps teams.
Instana – APM Observability sandbox.(Acquired by IBM)Lightstep – Full-context observability.(Acquired by Servicenow)- LogicMonitor – one platform, automatically correlating data.
- ManageEngine – 90+ observability products and tools.
- Microsoft – Observability for applications, infrastructure, and network.
- New Relic – Observability made simple.
- OpenTelemetry – An observability framework for cloud-native software.
- Oracle – Cloud Observability and Management Platform.
- Prometheus – flexible monitoring system and time series database.
- Solarwinds – Observability using Appoptics, Pingdom, Loggly, and more.
- Splunk – Full-stack, analytics-powered and enterprise-grade Observability Cloud.
The list continues. Suggestions and edits for consideration are always welcome.
- Alibaba Cloud – End-to-end monitoring platform.
- Amazon Cloudwatch – Observability for AWS resources and applications.
- Cribl – Delivering Control and Flexibility for Observability Data.
- Google Cloud – Collect metrics, logs, and traces across Google Cloud and your applications.
How is OpenTelemetry Standardizing Observability?
The adoption of observability is rising thanks to the increased availability of software vendors and other solutions, as recommended above. However, this trend requires telemetry data (metrics, tracing, and logs) to be as vendor-agnostic as possible.
Traditionally, the provision of telemetry data has been by either open-source projects or commercial software vendors. With a lack of standardization, the net result is a lack of data portability that places the responsibility on the user to maintain the instrumentation.
The OpenTelemetry project solves these problems by providing a single, vendor-agnostic solution. OpenTelemetry is a collection of tools, APIs, and SDKs that provides you with:
- A single vendor-agnostic instrumentation library per language with support for both automatic and manual instrumentation.
- A single collector binary can be deployed in various ways, including as an agent or gateway.
- An end-to-end implementation to generate, emit, collect, process, and export telemetry data.
- Full control of your data, with the ability to send data to multiple destinations in parallel through configuration.
- Open-standard semantic conventions to ensure vendor-agnostic data collection
- The ability to support multiple context propagation formats in parallel to assist with migrating as standards evolve.
- A path forward, no matter where you are on your observability journey. With support for a variety of open-source and commercial protocols, format and context propagation mechanisms, and providing shims to the OpenTracing and OpenCensus projects, it is easy to adopt OpenTelemetry.
The project has growing industry support and adoption from cloud providers, vendors, and end users.
What about Security Observability?
Online business conditions are changing, and there is no doubt that observability is essential. However, there is now an enormous opportunity and challenge created by delayed conversions about security observability (application security).
Software vendors and organizations must prioritize application security as much as they have quickly prioritized and established observability. A more unified, standardized, and collaborative approach to observability will create many security dividends.
Cybersecurity, as we discussed last time, will dominate news headlines in the coming months. As such, along with adding context to collected telemetry data, security will emerge as an instrumental component of observability.
Being able to detect runtime application vulnerabilities proactively then seamlessly mitigate or connect to 3rd party solutions for mitigation is a conversation we should be having now.
Some of the providers above are already doing just that, with specific offerings for application security.
Conclusion
For the past two years, there’s been a shift toward remote working and, at the same time, a noticeable surge in online traffic. As a result, it has become mission-critical for companies to implement observability.
Often, organizations are using a composite of traditional monitoring and observability software solutions to generate, emit, collect, process, and export telemetry data.
This shift has led to a variety of vendor solutions, programming languages, APIs, and so on. These necessitate that observability leaders now focus on 3rd-party integrations, open source, open standards, and, overall, a more consolidated approach. In addition, there is a need to reduce the complexity involved in combining multiple observability software vendors and open-source software solutions.
As always, I’m not here to endorse one vendor over another, so when it comes to observability, observability context, security observability, etc., feel free to add your feedback, suggestions, and questions below.
For more specific case-by-case vendor recommendations, reach out to me.
Published: Aug 16th, 2021 | Updated: November 22nd, 2025
