Guide to Network Troubleshooting in Linux
Network reliability is not just a convenience—it’s a cornerstone of operational integrity. Linux, known for its robustness and versatility, is the platform of choice for many network administrators. However, even the most robust networks can encounter hiccups that require advanced troubleshooting.
This article delves into Linux network troubleshooting, providing both casual users and system administrators with the knowledge and tools needed to diagnose and resolve intricate network problems effectively.

Basic Network Diagnostics Tools
Network troubleshooting is both an art and a science. It requires a blend of systematic methodology and creative problem-solving skills. Before diving into the complexities of network issues, it’s essential to grasp the basics of network diagnostics. These foundational tools—often taken for granted—serve as the initial line of defense when connectivity goes awry.
Starting with the Basics: ip, ping, traceroute commands
ip command
When connectivity issues arise, the ip command is your go-to tool. With ip addr show, you can verify that network interfaces are up and confirm their IP addresses. It’s more comprehensive than ifconfig because it can handle all the modern features of the Linux networking stack, like VLANs, IP tunnels, and more complex routing protocols. Although ifconfig is still found on many systems for backward compatibility, ip is the future-proof tool that aligns with the advanced networking features of the Linux kernel.
Continue reading the article: ip command from iproute2 – utilities for TCP/IP networking in Linux.
ping command
Next in the network troubleshooter’s arsenal is the ping command. It’s the equivalent of sonar in a sea of data, sending out ICMP (Internet Control Message Protocol) echo requests to target hosts. A successful ping confirms not only the operational status of the local network interface but also the reachability of the target system on the network. By sending a series of packets, ping can provide round-trip time metrics, which are invaluable for assessing network latency.
Continue reading the article: ping command in Linux with examples.
traceroute command
traceroute maps the journey that data takes from the source to the destination. By displaying the series of hops and the time taken for each hop, traceroute helps in pinpointing where potential delays or blockages occur. This tool can be particularly insightful when dealing with complex networks where data passes through multiple routers and paths.
Continue reading the article: traceroute command in Linux with examples.
A Systematic Approach to Network Troubleshooting
The significance of a systematic approach to network troubleshooting cannot be overstated. Like a physician diagnosing a patient, a network administrator must approach each problem methodically. The first step is to define the problem’s scope—is it a single user, an entire segment, or a system-wide issue? Once the scope is identified, the next steps are to gather information, identify the affected areas, establish a theory of probable cause, and then test that theory.
Information gathering starts with the basics: checking whether cables are plugged in and powered, ensuring that network interfaces are up and configured correctly, and confirming that the system’s IP settings are correct. From there, using ip addr ,ip link and ip route to check for proper IP address assignment, link status, and subnetting is crucial. If the IP layer is operational, ping and traceroute can help determine if the issue lies within the local network or beyond.
Each step in the process builds upon the last, and like a detective, a network troubleshooter must consider all the evidence. Sometimes, the issue is as straightforward as a disconnected cable, while other times, it may involve in-depth analysis of network traffic, configurations, or hardware.
Diving Deeper with More Advanced Tools

Once the foundational tools like ping and traceroute have been employed and the basics of the issue understood, it’s time to dive deeper. Advanced tools provide a more granular view of the network’s inner workings, allowing for precise identification and analysis of complex issues.
Tcpdump, netstat, iperf and others.
In this section, we explore tcpdump for packet analysis, netstat for monitoring network connections, and iperf for measuring bandwidth, all set against the backdrop of real-world scenarios.
Packet Analysis with tcpdump
tcpdump is the quintessential packet analysis tool that every sysadmin should be familiar with. It allows you to capture and inspect network packets at a granular level. Imagine a scenario where users are complaining about slow performance of a web application. tcpdump can be used to capture the traffic going to and from the application server to analyze if the requests and responses are happening in a timely fashion.
For instance, you can capture traffic on port 80 with:
tcpdump -i eth0 port 80
This command would provide a real-time stream of HTTP traffic, which could be further analyzed to identify if there are any unusual delays or retransmissions that might be causing the performance degradation.
Monitoring Connections with netstat
While tcpdump gives you a live view of packet-level traffic, netstat allows you to take a step back and view the network connections as a whole. This tool can help identify which sockets are open and what state they’re in. In the case of an application that seems to be unable to reach its database server, netstat can quickly reveal if there are any connections established on the database port and if not, whether the application is trying to initiate one and failing.
An example command would be:
netstat -tuln
This would list all listening ports and established TCP connections, without resolving hostnames or port names. Quick and to the point, it’s perfect for verifying whether the application and database servers have an open communication path.
Measuring Bandwidth with iperf
Bandwidth issues can be tricky to diagnose, but iperf is a specialized tool designed exactly for this purpose. It measures the maximum bandwidth of network links. Let’s say a remote office is experiencing slower-than-expected network speeds. By setting up iperf in server mode at the main office and then connecting to it from the remote office, you can measure the bandwidth between the two points.
To start iperf in server mode, use:
iperf -s
And to connect to this server from a client, you’d use:
iperf -c <server_ip_address>
This simple test can quickly confirm if the network link is performing at expected speeds or if there is a bottleneck that needs to be addressed.
By applying these tools in real-world scenarios, sysadmins can isolate issues more effectively and understand their network’s behavior under different conditions, leading to a more robust and reliable network environment.
tcpdump, netstat and iperf alternatives
It’s important to note that networking tools and recommendations will evolve over time. Please let me know if I’ve missed any of your favorites. You may be more familiar with alternative tools:
wireshark
Wireshark provides a more user-friendly, graphical interface for analyzing packets. However, tcpdump is preferred in environments where a GUI is not available or when working remotely via a command line interface.
ss command
Some modern Linux distributions are moving towards the ss command (part of the iproute2 package) as a replacement for netstat. ss can display more information than netstat and is faster in providing network statistics. It’s recommended to become familiar with ss if you’re working on a system that supports it.
iperf3
While there aren’t many direct alternatives to iperf, newer versions like iperf3 offer improved features and a more streamlined user experience. It’s advisable to use iperf3 if you’re setting up new bandwidth tests.
As with any tool, the choice often depends on the specific requirements of the task and the environment in which you are working. Also read my list of 60 Linux Networking commands and scripts!
Monitoring network performance

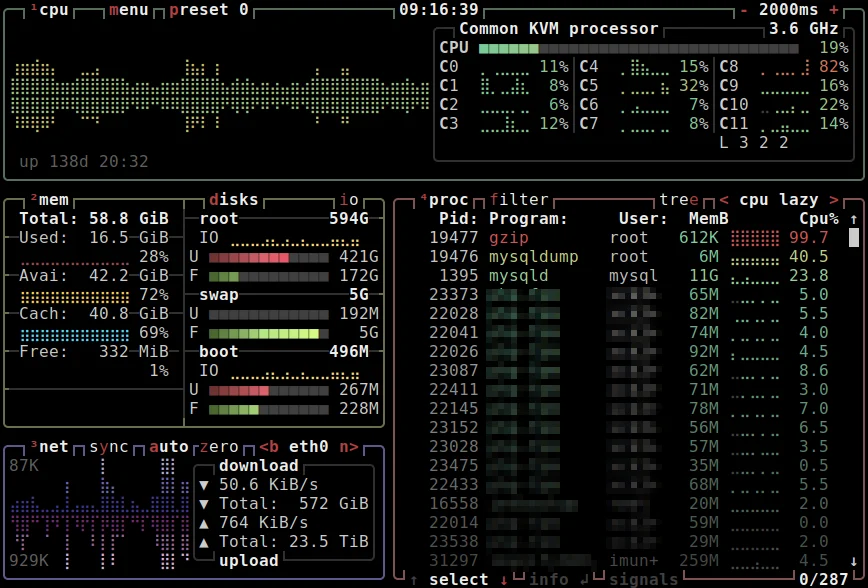
Using bpytop and Btop with network preset. (both hosted by stacklinux.com)
In the realm of network management, ongoing monitoring is essential. Establishing baseline performance metrics and continuously monitoring them can preemptively identify potential issues before they escalate into significant problems. This section delves into the importance of these practices and explores tools like nload, iftop, and nethogs.
The Importance of Ongoing Network Monitoring
Continuous network monitoring is crucial for maintaining the health and efficiency of a network. It allows administrators to:
- Detect Issues Early: By continuously monitoring network traffic, anomalies can be detected early, often before users are impacted.
- Establish Performance Baselines: Understanding the normal operating parameters of your network is essential for identifying when things are not functioning as they should.
- Plan for Capacity: Monitoring helps in understanding usage patterns and planning for future capacity needs.
- Ensure Compliance and Security: Continuous monitoring can also help in ensuring that the network complies with security policies and standards.
Baseline Performance Metrics
Establishing baseline metrics is the first step in effective network performance monitoring. Baselines provide a point of comparison for future measurements, making it easier to spot when something is amiss. Key metrics to track include:
- Bandwidth Usage: How much bandwidth is being used and by which applications or services.
- Latency: The time it takes for data to travel from one point to another in the network.
- Packet Loss: The rate at which packets are lost during transmission.
- Throughput: The rate of successful message delivery over a communication channel.
Real-Time Monitoring with nload
nload is a console application that provides real-time network traffic and bandwidth usage. It is user-friendly and displays incoming and outgoing traffic separately. For example, running nload on a server can instantly show if there is an unexpected spike in traffic, which could indicate a problem or a security issue like a DDoS attack.
Network Traffic Analysis with iftop
iftop is like the top command but for network usage. It provides a real-time view of network bandwidth usage on an interface. iftop displays source and destination pairs and the amount of data being transferred between them. This level of detail is invaluable for identifying which connections are consuming the most bandwidth and can be particularly useful for troubleshooting network congestion or bottlenecks.
Monitoring Per-Process Network Activity with nethogs
While tools like iftop and nload monitor network traffic at the interface level, nethogs goes a step further by breaking down traffic per process. This is incredibly useful for identifying which specific processes are consuming the most bandwidth. For instance, if a server is experiencing high network load, nethogs can help pinpoint whether it’s due to legitimate usage by a service or an errant process consuming more than its fair share.
Network Troubleshooting: Firewall and Security Issues

Cloudflare Security Analytics page.
As we approach the conclusion of this guide on network troubleshooting, it’s imperative to focus on a crucial aspect of network management: troubleshooting network firewall issues and addressing common security challenges.
Troubleshooting Network Firewall Issues
Firewalls are the gatekeepers of the network, ensuring only authorized traffic is allowed. However, they can sometimes become the source of network issues.
- Detecting Issues: Common signs of firewall problems include an inability to access certain services or applications, slow network performance, or unexpected disconnections.
- Addressing Issues: The key to resolving firewall issues lies in systematically reviewing and testing the firewall rules and configurations. Ensure that rules are not too restrictive, blocking legitimate traffic, or too lax, exposing the network to risks.
- Tools:
iptablesandufwoffer detailed logs that can be invaluable in this process. As well as, Cloudflare and ConfigServer Security and Firewall.
Responding to DDoS Attacks
DDoS attacks can overwhelm a network with traffic, causing significant disruption.
- Detection: An abrupt and massive spike in traffic, particularly from multiple sources, is a strong indicator of a DDoS attack.
- Mitigation: The immediate response should include rate-limiting incoming traffic and potentially rerouting or blocking traffic from suspicious IPs. Long-term strategies may involve using DDoS protection services and implementing robust network architecture with redundancy to absorb such attacks.
- Tools: Wireshark and Snort are essential tools for network analysis, offering the capability to detect and log detailed information about DDoS attacks and other security threats.
Addressing Unauthorized Access Attempts
Unauthorized access attempts can lead to data breaches or service disruptions.
- Detection: Monitoring tools like intrusion detection systems can alert administrators to unusual access patterns or login attempts, indicating potential unauthorized access.
- Resolution: Strengthening authentication mechanisms, updating firewall rules to block suspicious IPs, and ensuring systems are up-to-date with security patches are effective ways to respond to these incidents.
- Tools: Fail2Ban and OSSEC are powerful tools adept at detecting and mitigating unauthorized access attempts on a network.
Resolving Malware Intrusions
Malware can disrupt network operations and compromise security.
- Detection: Unusual network traffic, unexpected system behavior, or alerts from antivirus tools can indicate malware presence.
- Eradication: Isolating infected systems, running comprehensive malware scans, and analyzing network traffic for signs of malware communication are essential steps in addressing this issue.
- Tools: ClamAV and Malwarebytes are reputable tools widely used for effectively detecting and eliminating various forms of malware intrusions. As well as, Imunify360 AV.
Understanding Network Protocols

Understanding the layers of the TCP/IP model is crucial for effective troubleshooting. Each layer has distinct functionalities and common issues associated with it. By breaking down these layers and understanding the typical problems at each level, network administrators can more effectively diagnose and resolve network issues.
The TCP/IP Model: A Layered Approach
The TCP/IP model consists of four layers: 1) the Link Layer, 2) the Internet Layer, 3) the Transport Layer, and 4) the Application Layer. Each layer serves a specific function in the process of transmitting data over a network. Let’s take a look at each layer.
Link Layer (Network Interface Layer)
This layer is responsible for the physical transmission of data over network hardware. It includes protocols for Ethernet and Wi-Fi.
Common Issues:
- ARP Issues: Address Resolution Protocol (ARP) is used to map IP addresses to physical MAC addresses. Problems here can lead to failures in locating devices on the same network, resulting in communication issues.
- Hardware Problems: Issues with network adapters, cables, and switches fall into this category. Faulty hardware can lead to packet loss or complete communication failures.
Internet Layer (Network Layer)
This layer handles the movement of packets around the network. IP (Internet Protocol) is the primary protocol at this level.
Common Issues:
- IP Addressing Problems: Incorrectly configured IP addresses, subnet masks, and gateways can lead to routing problems.
- Routing Issues: Misconfigured routing tables can cause packets to take inefficient paths or get lost entirely.
Transport Layer
The transport layer is responsible for end-to-end communication and error-checking. It includes protocols like TCP (Transmission Control Protocol) and UDP (User Datagram Protocol).
Common Issues:
- TCP Window Size Problems: Incorrectly configured TCP window sizes can lead to inefficient data transfer, affecting performance.
- Port Conflicts: Multiple applications trying to use the same port can lead to conflicts and connectivity issues.
Application Layer
This layer consists of the protocols used by applications to communicate over the network, such as HTTP, SMTP, and FTP.
Common Issues:
- Protocol Misconfigurations: Incorrect settings in application protocols can lead to failures in application services.
- DNS Problems: Issues with Domain Name System (DNS) resolution can cause problems in reaching websites or services by name.
Troubleshooting Across Layers
Effective network troubleshooting often involves looking at problems across these layers. For instance, a connectivity problem might seem like a routing issue at the Internet layer but could actually be due to a hardware failure at the Link layer. Similarly, slow website loading times might not be a problem with the web server itself (Application layer) but could be due to TCP window size issues at the Transport layer.
Understanding the typical issues at each layer helps narrow down the possibilities when diagnosing problems. For example, if users are unable to access a particular server, checking the ARP tables (Link layer) and routing configurations (Internet layer) would be initial steps. If there is a problem in data transfer speeds, examining the TCP configurations at the Transport layer would be a sensible approach.
Additional Network Troubleshooting Tools and Reading
In our exploration of network troubleshooting, we have delved into a wide array of tools that are essential for diagnosing and resolving various network issues. Hopefully, the reading and links thus far in this article has equipped you with the knowledge and resources to begin tackling Linux networking challenges. That said, here are some additional network troubleshooting tools and reading.
Additional Network Troubleshooting tools
- dig: a versatile command for querying DNS name servers, providing detailed information about host addresses, mail exchanges, name servers, and DNS records.
- ethtool: a versatile command-line utility used for querying and controlling network driver and hardware settings, especially for Ethernet devices.
- iw: a command-line tool used for configuring and managing wireless devices in Linux.
- ip neigh: replaces the traditional
arpcommand, for managing the ARP table and resolving IP addresses to MAC addresses. - ncat: a feature-rich networking utility from the Nmap project, for data transfer, scripting, and network debugging.
Additional Network Troubleshooting reading
- 60 Linux Networking commands and scripts.
- 100 Top Observability Tools (+ Server Monitoring and APM solutions).
- 25 Best CDN Providers,
- Linux benchmark scripts and tools.
- 5 Network Devices for work-from-home and Small Business, 2023.
- Must-Have Devices to boost your Linux skills.
Conclusion
In conclusion, while advanced tools and techniques are indispensable for complex issues, never underestimate the diagnostic power of ifconfig, ping, and traceroute. These tools not only provide the first line of insight into network health but also remain crucial components of any network administrator’s toolkit. By applying a systematic approach to the use of these tools, one can efficiently and effectively diagnose and address a multitude of common network issues.
In an upcoming article, we will exclusively focus on the vital aspect of network security. This piece will delve into the complexities of securing a network, discussing advanced strategies and tools that are essential for safeguarding against the evolving landscape of cyber threats.
We’ll explore the intricacies of firewall configurations with iptables and UFW, and the critical role of intrusion detection systems in identifying and mitigating security breaches. This forthcoming discussion promises to be an essential guide for network administrators and IT professionals, providing them with the insights needed to fortify their networks against external and internal security challenges.