btop – the htop alternative

Have you ever experienced slow application performance on a server and wondered which process was causing the bottleneck? In a production server environment, monitoring system performance and hardware resource usage in real-time is crucial. That’s where system monitoring tools come in handy. And, with the availability of numerous command-line system monitoring tools, you’re spoiled for choice. From top, htop, glances, nmon, ytop, gtop, vtop, to atop, the list is endless!
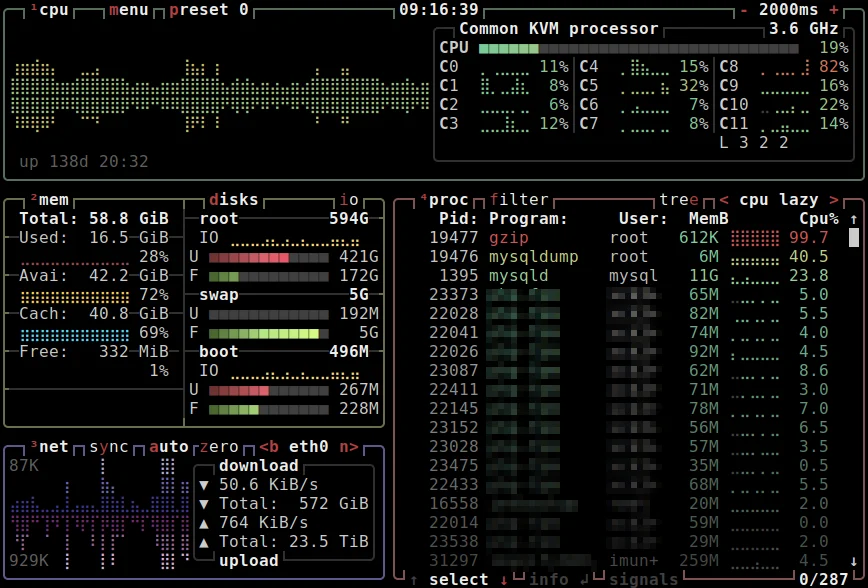
However, one particular tool that caught my attention is btop, the aesthetically pleasing system resource monitor that shows usage and stats for processor, memory, disks, network, and processes. With a few keyboard shortcuts, you can easily switch between sorting options, view detailed stats for processes, and even send a signal to a selected process.
In this blog post, we’ll quick-dive into how to use btop to monitor system resources and highlight some of its features. Plus, we’ll touch on the importance of application performance monitoring (APM) and observability for deeper and more detailed insight into your code’s effect on resources and the end-user experience.
Welcome to btop!
Meet btop, an aesthetically pleasing system resource monitor showing usage and stats for processor, memory, disks, network, and processes. btop is the lighter and faster C++ version and continuation of bashtop and bpytop.
Using btop to monitor system resources
First, download and install btop. One of the most striking features of btop is its ease of use. The UI is controlled using a shortlist of keyboard shortcuts, making it easy for users to navigate and switch between sorting options. Additionally, btop supports full mouse support, and all buttons with a highlighted key are clickable, which makes navigation even more accessible.
Here’s a list of a few of the keyboard shortcuts:
(Esc, m) - Shows the main menu.
(F2, o) - Shows options.
(F1, h) - Shows the help screen.
(Ctrl-C, q) - Quits the program.
(+, -) - Add/Subtract 100ms to/from update timer.
(Up arrow) (Down arrow) - Select in the process list.
(Enter) - Show detailed information for the selected process.
(Pg Up) (Pg Down) - Jump 1 page in the process list.
(Home) (End) - Jump to the first or the last page in the process list.
(Left) (Right) - Select previous/next sorting column.
(b, n) - Select previous/next network device.
(e) - Toggle processes tree view.
(r) - Reverse sorting order in processes box.
(f, /) - Input a string to filter processes with.
Use the help menu for even more keyboard shortcuts.
With btop, you can view detailed stats for processes, send SIGTERM, SIGKILL, SIGINT to a selected process, and easily filter processes. btop also supports a tree view of processes, allowing you to visualize the relationship between different processes on your system. btop is also available in a growing list of official repositories of recent distros.

btop – filtering ‘newrelic’ processes/threads
Another useful feature of btop is the ability to view real-time read and write speeds for your storage devices. This feature allows you to keep track of the performance of your disks and identify any bottlenecks or issues that may be affecting their performance.
btop features
- An easy-to-use and esthetically pleasing user interface that features a beautiful system stats overview.
- Full mouse support, all buttons with a highlighted key are clickable and mouse scroll work in the process list and menu boxes.
- Fast and responsive UI with UP and DOWN keys process selection.
- Function for showing detailed stats for the selected process.
- Ability to filter processes.
- Easy switching between sorting options.
- Tree view of processes.
- Send any signal to the selected process.
- UI menu for changing all config file options.
- Auto-scaling graph for network usage.
- Shows IO activity and speeds for disks
- Battery meter
- Selectable symbols for the graphs
- Custom presets
- Available in a growing list of official repos of recent distros. For example, Manjaro install =
pacman -S btop. - Also compatible with Mac and FreeBSD.
- Uses less CPU and RAM compared to bashtop and bpytop.
Taking monitoring a step further
Command-line system monitors will often give you a quick insight into what process(es) are culprits for poor application performance. It’s an excellent place to start.
However, if you are serious about application performance, you’ll want to set up application performance monitoring (APM). APM is a core component of observability; they provide a deeper and more detailed view of your code’s effect on resources, as well as insight into the end user’s experience with your application.
Observability empowers you with the data necessary to decide whether to optimize code or to upgrade hardware. With this in mind, I maintain a list of over 100 observability solutions that will interest you if you run or plan to run apps in production. Also, read Observability in 5 minutes. Plus, the best 20 observability software vendors.
Conclusion
Overall, btop is an excellent choice for power users and sysadmins looking for a simple yet powerful system monitoring tool that provides real-time usage and statistics for different hardware resources.
In a mission-critical setting, top, htop, and atop are still time-proven system resource monitoring and troubleshooting solutions along with other useful tools such as net-tools, iptraf, collectl, dstat, iostat, iotop, sar, saidar, and vmstat. Also, check out 90 Linux Commands frequently used by Linux Sysadmins.
I’ve been using btop on my laptop and a few servers when I need to share easy-to-read screenshots of memory, CPU, or other stats. If you haven’t already, give it a try!
Published: November 3rd, 2021 | Last updated: October 23rd, 2024

btop is pretty nice but top is still king
I am not a server farm admin, just a desktop Linux user. Used top in the past, moved to htop, and now I am a happy btop user. Easy on the eyes, shows everything I need to know at a glance, easy to recommend!
I can get that. Welcome to the forums Pedro.
Welcome to the forums @Pedro_Galvan
I’m an htop heavy user. What can btop do that htop cannot and how can it find bottlenecks?