How to forecast metrics with Checkmk
In case you are responsible for any kind of server, you probably are aware of bad surprises that sometimes crash your plans after work or for the weekend. Suddenly, a server goes down, and you have to react to an incident because other people and systems depend on it. In this tutorial, I want to show you how to counteract such events by using the forecasting feature in Checkmk, an open source monitoring tool by tribe29.
As an example, I will predict the growth of a file system of a file server. Forecasting is just one of many handy features in Checkmk to make your monitoring better. If you want to take your file server monitoring to the next level, there is a complete file server tutorial on the Checkmk blog. Checkmk can help you with a forecasting engine that goes beyond a linear fit, but you still should think about the context of any forecast. I will explain the exact details behind the mathematical mechanisms in the end.
How to use the forecasting of Checkmk
This tutorial works for any kind of server with a file system. Checkmk has matching agents Linux, Unix, and Windows servers. Also, there are matching integrations for file server protocols such as FTP, NFS, or SMB/CIFS. To pull the monitoring data from my Linux file server, I am using the Checkmk Linux agent, but you can also use other methods if you like. If you want to use the Checkmk agent on your server, you need admin access to it.
You also need a Checkmk instance up and running, of course. In my example, I am using the Checkmk Free Edition version 2.1 that you can use and download for free. If you are not sure how to set up Checkmk and add a server to the monitoring, you can follow the Checkmk guide on how to install Checkmk.
The forecasting feature is available in the Checkmk user interface and all actions will take place here. You should make sure that you have sufficient monitoring data, so the forecast is reliable. If you have less than two days of data, Checkmk will not even try to create a forecast.
Step 1: Select the monitoring service you want to predict
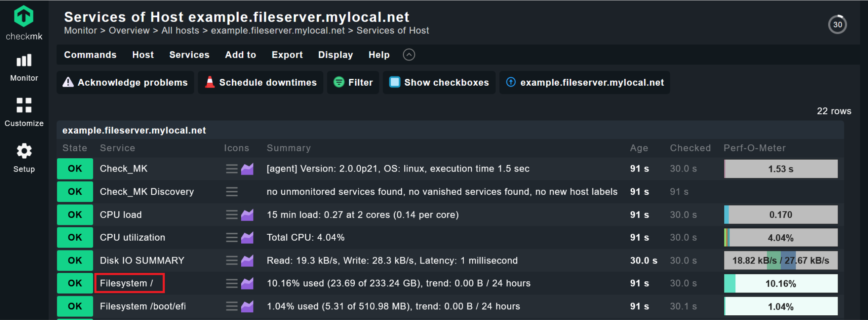
Open Checkmk and find the monitoring service you want to use for your forecast. It needs to be a service that can be used as a metric. Nominal data such as the validity of a certificate, for example, cannot be predicted this way. In my case, I decided to use the service ‘File server /’ of the host ‘example.fileserver.mylocal.net’.
- Go to Monitoring -> All host in Checkmk.
- Click on the host, which contains the service you want to forecast. In my case ‘example.fileserver.mylocal.net’.
- Choose the service of the file system you want to predict. In my case, I want to monitor the full partition, so I go to ‘Filesystem /’ by clicking on it.

- Scroll down and pass the graphs to the point Service Metrics.
- Click on the action menu behind the metric you want to predict, I went for Used filesystem space %:, and then choose the option ‘New forecast graph’.

Step 2: Adjust your forecast
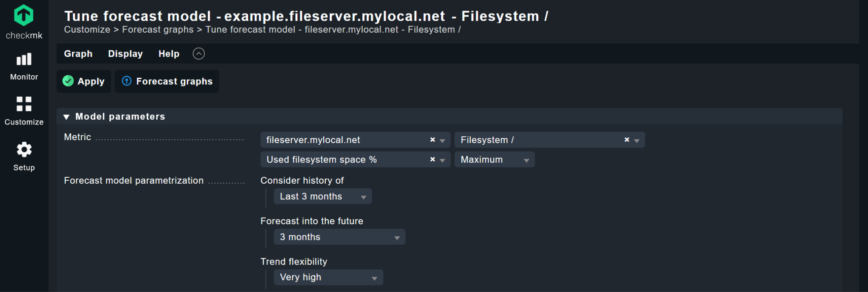
Now, you see the default paragraph and can now adjust the parameters for the forecast under Model parameters. You do not have to adjust much, and I will explain the options in detail after this step. Focus now only on the most important changes.
- Because I have been monitoring this server since the beginning of the year, I adjust Forecast model parametrization to ‘Last 3 months’. The more data you have collected, the better, of course.
- Under Forecast into the future, I go for ‘3 months’, because I want to check if I have to expect anything during my summer holiday.
- Because I want my forecast to react to trends as fast as possible, I change the Trend flexibility to ’Very high’. I do that because I do not expect any sudden changes in my file server usage. Checkmk will now adjust the prediction faster to changes in the trend. You can leave all to other fields for now and click on Apply. Checkmk will adjust the graph accordingly.

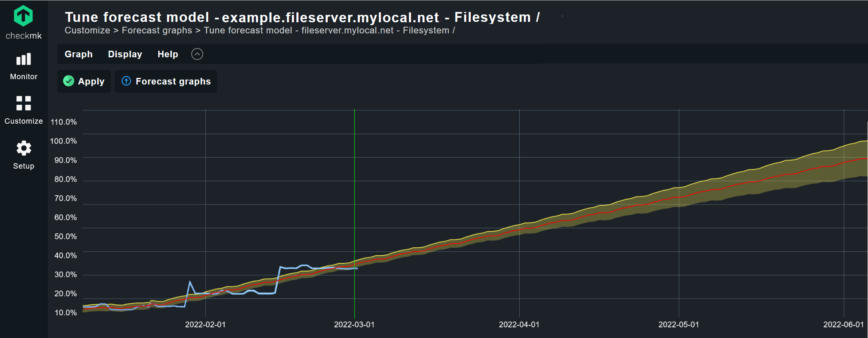
And that was it, just two simple steps. The blue line is the actual monitoring data, and the line in red is the forecast. The yellow field is the tolerance area for the forecast. My file server will probably be fine until July, however, I should take action, if I want to go on vacation in that time period, because otherwise, I am running the risk of getting a critical notification during my holiday, or even worse, the file system of my file server runs out of space. Checkmk also realized the peaks at the end of January and in the middle of February and adjusted the forecast.

I will react before going on my summer vacation, just to be sure. Without the forecasting, you can imagine what happened. Probably the notification by your monitoring about the critical condition on the file server would get lost, or you would see it when it’s too late. You run the risk of getting an angry call from work while on holiday, or would be somewhere with terrible internet access trying to deal with the issue (we all have been there and done that) but with Checkmk you now have a tool that helps you avoid these situations.
The graph will automatically be saved, and you can find it under Customize -> Forecast graphs. You can adjust graphs and open them, once you need them again.
Adjusting the Checkmk forecast engine
Instead of one straight graph, Checkmk does a piece-wise linear fit and recognizes breaks. You might ask yourself about the magic behind Checkmk adjusting the forecast to trends and outliers. The math behind this is based on Bayes analysis that allows Checkmk to change the function of the graph. To make this work, you have to provide a prior probability that decides how quickly the graph should react to changes.
You did that already when you adjusted the Trend flexibility to ’Very high’ before. Checkmk provides default values for all fields including the probability in the Model parameters, but it is worth checking what is behind them, so you can create precise forecasts for any metric, for instance for capacity management.
Under Metric you can change the host, the service, and the metric you want to predict. Some services have more than one value at a time. In most cases, you want to use the ‘maximum’ value, but in the case of CPU utilization, it could make sense to use the average instead of the maximum value, for example. CPU utilization changes fairly often, depending on the workload of your server. Thus, the average gives probably a more accurate result.
Under Forecast model parametrization, you should adjust your forecast. The first two points Consider history of and Forecast into the future are straightforward. You tell Checkmk, which collected monitoring data it shall use and how far it shall forecast. The more data you have, the more precise is your forecast, but also consider changes that impact the monitoring services you aim to predict. For example, if additional applications start using your file server at one point, you should only consider the data after you made those changes.
At Trend flexibility, you decide on the prior probabilities for the Bayes analysis. Or in other words, you tell Checkmk how quickly to adjust your trend graph in case of structural breaks or changepoints. You have five options, “medium” is fine for most use cases and, thus, default. If you want your trend to react stronger to outliers, then you should switch to ‘High’ or ‘Very high’, as you did in the example before.
Model seasonality decides how Checkmk handles recurring behaviors. Checkmk recognizes recurring patterns over a certain timescale, like weekends or public holidays. This is important because it stops recurring and seasonal demands to bias your forecast. Checkmk considers two time frames automatically in the forecast graphs – weekly recurring requirements, such as for a five-day working week and weekends, and annual or seasonal requirements, such as those related to public holidays and staff holidays. Such recurring patterns can be considered as constant, or they could be growing. The option ‘Additive’ tells Checkmk all these oscillations have the same amplitude over time, whereas ‘multiplicative’ means that they are amplified by the magnitude of the trend.
Confidence interval does not actually affect your forecast graphics but the visualization. If you accept a lower level of confidence, your interval will get narrower. The option ‘Display historic data since the last’ gives you the option to show the collected monitoring data from the past in a blue line.
If you check Model parameters, the previously selected parameters will be displayed below the finished graph. This makes it easier for the viewer to interpret the graph. All these options can help you to make your forecasts more precise, but you do not have to change any parameters.
Summary
This tutorial introduced the forecasting feature of Checkmk. You can forecast any kind of monitoring service that creates metric data, but the prediction is especially of value for file systems. You can forecast any monitoring service in Checkmk, of course. The precision of the mathematical analysis combined with the default values provides a precise tool for capacity management that uses advanced mathematical methods, but also provides templates, so it is easy to use.
Forecasting is useful if you have to take care of different kinds of servers. However, there is more to server monitoring than just this one feature. You find more background information about server monitoring in general on the Checkmk website.