htop and top Alternatives: Glances, nmon
In this article, we explore alternatives to htop and top, namely, Glances and nmon. These tools present unique approaches and functionalities, potentially serving as replacements or supplements to the classic top and htop duo. Join us as we uncover the features and benefits of Glances and nmon, and whether they could be the next staples in your system monitoring toolkit.
Previously we looked at top, atop, and indirectly (due to its popularity) htop. Regarding system health and performance, this is a matter of preference regarding the displayed data most important to you. We all prefer different ways of viewing the same data. Update: also consider btop.
htop and top alternatives

Since the three aforementioned system monitoring tools can hold their own easily, I’ll focus on two alternatives, which, I believe, can hold their own as replacements or at least complement top and htop. They are Glances and nmon.
Glances – system monitor

Glances is open-source software to monitor and collect operating system statistics. Glances aims to present the max amount of information in the minimum amount of space. Glances is an excellent htop alternative as it can adapt dynamically when displaying system information, depending on the terminal size. Remote monitoring can be done via terminal, Web interface, or API (XMLRPC and RESTful). Glances is written in Python and uses the psutil library to get information from your system. Stats can also be exported to external time/value databases.
nmon – Nigel’s performance Monitor

nmon is another htop alternative system administrator tool for server tuning, benchmarking, or viewing detailed system performance information. It outputs data in two ways. Either on the screen (command line) or after saving data to a comma-separated file for analysis and longer-term data capture. Honestly, one screenshot isn’t enough for nmon. Have a look at additional screenshots with explanations.
Even more top and htop alternatives: net-tools, iptraf, collectl, dstat, iostat, sar, saidar, and vmstat. Are you looking for more insight and APM tools? Also, read my 50 Top Server Monitoring & Application Performance Monitoring (APM) Solutions post (includes free and paid solutions).
Conclusion
In conclusion, while top and htop have their merits, the exploration of Glances, nmon and btop reveals the rich diversity of tools available for system monitoring. Each tool brings its unique strengths, catering to different needs and preferences in data representation and system analysis. Whether you seek a comprehensive overview or detailed insights, expanding your toolkit with these alternatives can enhance your monitoring strategy and system management efficiency.
Originally published: Jun 15th, 2017 | Last updated: Jan 22nd, 2024.

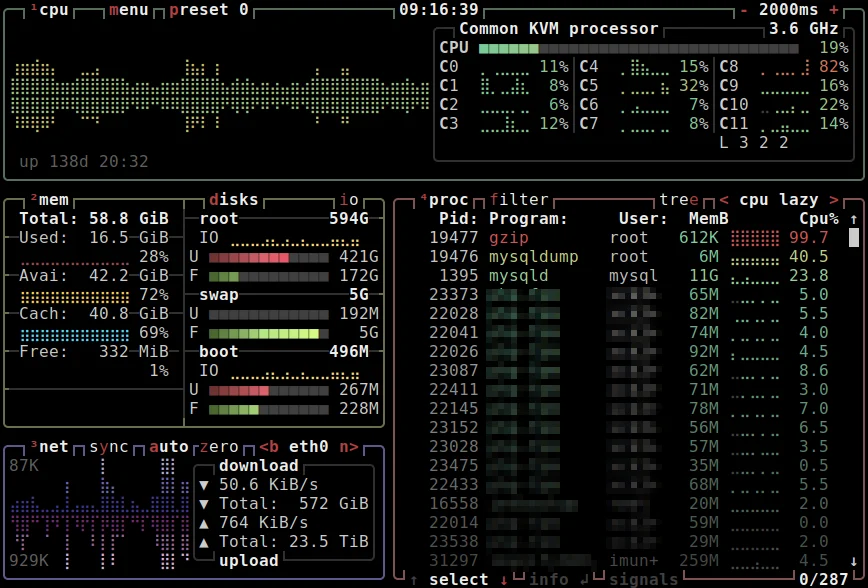
Recently came across bpytop, which is now my monitor of choice across all platforms.
It combines ease of use (once one understands the very simple shortcuts) with high information density in a single pane
;-}
P
Used that one also. Also, check out btop:
btop (btop++) is the third iteration of bashtop->bpytop. It’s being written in C++ and will simply be called
btop