bashtop – the ‘cool’ top alternative.
btop is better, please see: btop – the htop alternative.
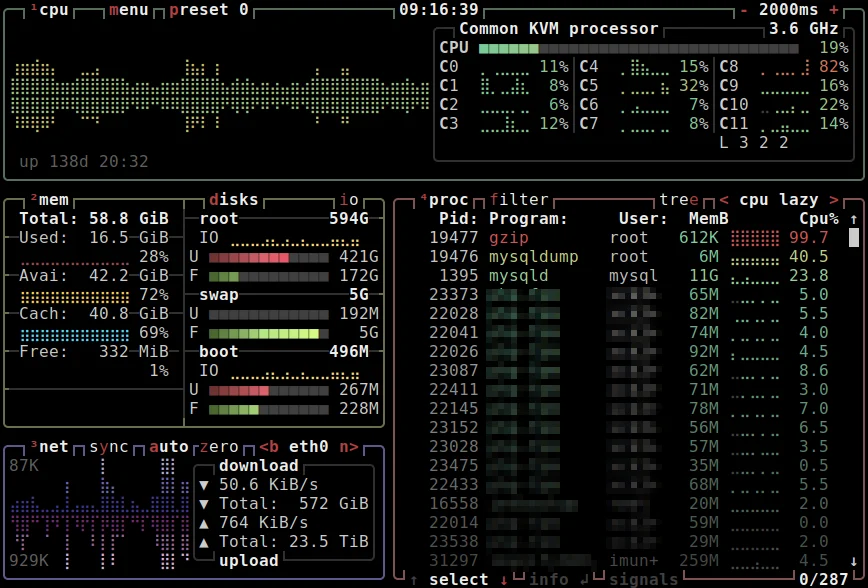
Meet bashtop, an esthetically pleasing system monitor, written completely in Bash. Yup, you can view all 5000 lines of code, by simply opening /usr/bin/bashtop with a text editor or view on Github.
Over the years, the available options for command-line system monitoring tools have grown quite a bit. There is top, htop, glances, nmon, ytop, gtop, vtop, and atop to name a few. When it comes to Linux administration, monitoring your system’s performance, and use of hardware resources in real-time is very important and becomes critical in production server environments.

Bashtop displays the usual usage and stats for processor, memory, storage, network, and processes.
Using BASHTOP
As soon as you launch bashtop you’ll notice it’s very easy to use. The UI is controlled using this short list of keyboard shortcuts:
(Esc, M, m) - Shows main menu.
(F2, O, o) - Shows options.
(F1, H, h) - Shows help.
(Ctrl-C, Q, q) - Quits program.
(+, A, a) (-, S, s) - Add/Subtract 100ms to/from update timer.
(Up arrow) (Down arrow) - Select in process list.
(Enter) - Show detailed information for selected process.
(Pg Up) (Pg Down) - Jump 1 page in process list.
(Home) (End) - Jump to first or last page in process list.
(Left) (Right) - Select previous/next sorting column.
(b, B) (n, N) - Select previous/next network device.
(E, e) - Toggle processes tree view.
(R, r) - Reverse sorting order in processes box.
(F, f) - Input a string to filter processes with.
(C, c) - Clear any entered filter.
Selected (T, t) - Terminate selected process with SIGTERM - 15.
Selected (K, k) - Kill selected process with SIGKILL - 9.
Selected (I, i) - Interrupt selected process with SIGINT - 2.
With bashtop, you can quickly view detailed stats for processes, easily switch between sorting options, send SIGTERM, SIGKILL, SIGINT to a selected process, view current read and write speeds for your storage devices and much more.

Filtering to display only Nginx related processes.
Bashtop pros
- An easy-to-use and esthetically pleasing user interface that features a beautiful system-stats overview.
- Available in official repos of recent distros such as Ubuntu 20.10 –
apt install bashtopand CentOS 8 –dnf install bashtop. - Also compatible with Mac and FreeBSD.
Bashtop cons
- Uses more CPU and RAM compared to top and htop.
- Requires bash v4.4 or later. (not friendly to older distros like CentOS 7).
Conclusion
In a mission-critical setting, top, htop, and atop are still the best / time-proven options. Along with other useful tools such as net-tools, iptraf, collectl, dstat, iostat, iotop, sar, saidar and vmstat. For example, if you need to login to a remote Linux server that is experiencing high load or low available memory, consider memory and cpu footprint when selecting which tool to launch.
I’ve been using bashtop on my laptop and on some servers when I need to share easy-to-read memory, cpu, or process stats. If you haven’t already, give it a try!
System monitors like bashtop are a gateway to APM
Command-line system monitors will often give you quick insight into what process(es) are the culprit for poor application performance. It’s a good place to start.
However, if you are serious about application performance, you’ll want to set up application performance monitoring (APM). APM provides a deeper and more detailed view of your code’s effect on resources as well as insight into the end-users’ experience with your application.
APM empowers you with the data necessary to decide whether to optimize code or to upgrade hardware. With this in mind, I maintain a list of over 100 APM solutions that will be of interest to you if you run or plan to run, apps in production.