What is Linux iowait? (Explained With Examples)
iowait (wait, wa, %iowait, wait%, or I/O wait) is often displayed by command-line Linux system monitoring tools such as top, sar, atop, and others. On its own, it’s one of many performance stats that provide us insight into Linux system performance.
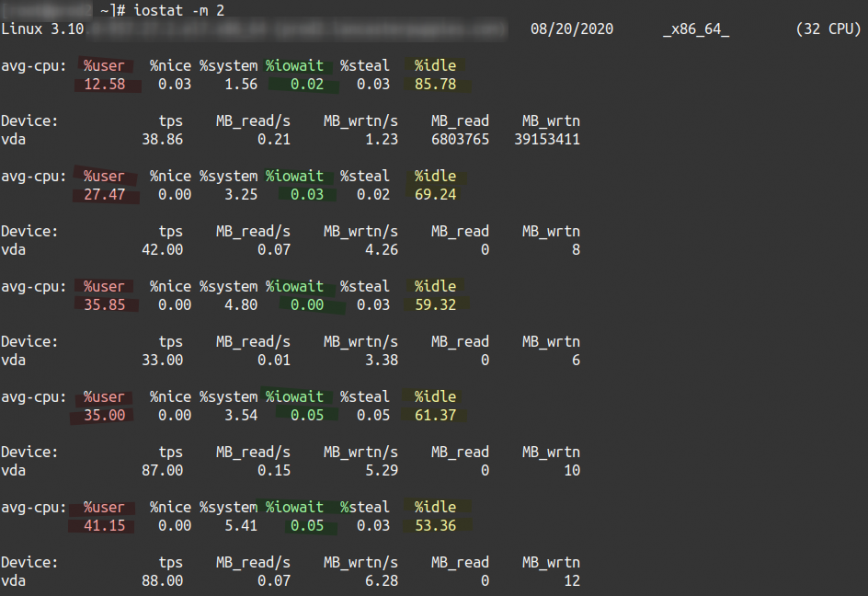
I/O wait came up in a recent discussion with a new client. During our support call, they reported load spikes of 60 to 80 on their 32 CPU core system. This resulted in slow page loading, timeouts, and intermittent outages. The cause? Storage I/O bottleneck was initially hinted at by a consistently high iowait and later confirmed with additional investigation.
What is I/O wait? How does I/O wait affect Linux server performance? How can we monitor and reduce I/O wait related issues? Continue reading for the answers to these questions.

iowait example 1 – using iostat.
What is iowait?
I/O wait (iowait) applies to Unix and all Unix-based systems, including macOS, FreeBSD, Solaris, and Linux.
I/O wait is the percentage of time that the CPU (or CPUs) were idle during which the system had pending disk I/O requests. (Source: man sar) The top command’s man page gives this simple explanation: “I/O wait = time waiting for I/O completion.” In other words, the presence of I/O wait tells us that the system is idle when it could be processing outstanding requests.
“iowait shows the percentage of time that the CPU or CPUs were idle during which the system had an outstanding disk I/O request.” – iostat man page.
When using Linux top and other tools, you’ll notice that a CPU (and its cores) operate in the following states:
- us (user).
- sy (system).
- id (idle).
- ni (nice).
- si (software interrupts).
- hi (hardware interrupts).
- st (steal).
- wa (wait).
Of these, the ‘user’, ‘system’, ‘idle’, and ‘wait’ values should add up to 100%. Note that “idle” and “wait” are not the same. “Idle” CPU means there is no workload present while, on the other hand, “wait” (iowait) indicates when the CPU is waiting in an idle state for outstanding/waiting requests.
If the CPU is idle, the kernel will ascertain any pending I/O requests (i.e., NVMe or NAS) originating from the CPU. If there are, then the ‘iowait’ counter is incremented. If nothing is pending, then the ‘idle’ counter is incremented.
iowait and Linux server performance
It’s important to note that iowait can, at times, indicate a bottleneck in throughput, while at other times, iowait may be completely meaningless. It’s possible to have a healthy system with some iowait, but also possible to have a bottlenecked system without iowait.
I/O wait is simply one of the indicated states of your CPU and CPU cores. A high iowait means your CPU is waiting on requests, but you’ll need to investigate further to confirm the source and effect.
For example, server storage is almost always slower than CPU performance. Because of this, I/O wait may be misleading, especially when it comes to random read/write workloads. Iowait only measures CPU performance, not storage I/O.
Although iowait indicates that the CPU can handle more workload, depending on your server’s workload and how load performs computations or makes use of storage I/O, it isn’t always possible to solve I/O wait. Nor is it always feasible to achieve a zero value.
Based on end-user experience, database health, transaction throughput, and overall application health, you will have to decide whether the iowait reported indicates poor Linux system performance.
For example, if you see an iowait of 1 to 4 percent, and you then upgrade the CPU to 2x the performance, the iowait will also increase. A 2x faster CPU with the same storage performance = ~ 2x the wait. You’ll want to consider your workload to determine which hardware you should pay attention to first.
Monitoring and reducing I/O wait related issues

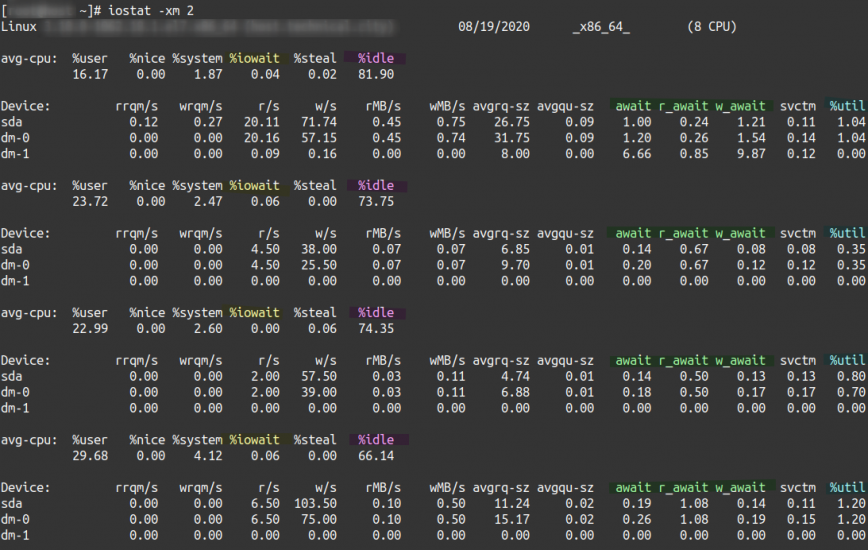
Using iostat -xm 2 to check for iowait.
Let’s look at some valuable tools used to monitor I/O wait on Linux.
atop– run it with -d option or pressdto toggle the disk stats view.iostat– try it with the-xm 2options for extended statistics, in megabytes and in two-second intervals.iotop– top-like I/O monitor. Try it with the-oPaoptions to show the accumulated I/O of active processes only.ps– useauxf, then under the “STAT” column “D” usually indicates disk iowait.strace– view the actual operations issued by a process. Read thestraceman page.lsof– after you’ve identified the process responsible, use-p [PID]to find the specific files.
Reducing I/O wait related issues.
Take the following steps to reduce I/O wait related issues.
- Optimize your application’s code and database queries. This can go a long way in reducing the frequency of disk reads/writes. This should be your first approach because the more efficient your application is, the less you’ll have to spend on hardware long-term. See also: 100 Application Performance Monitoring (APM) & Observability Solutions.
- Keep your Linux system and software versions up-to-date. Not only is this better for security, but more often than not, the latest supported versions offer notable performance improvements, whether it’s Nginx, Node.js, PHP, Python, or MySQL.
- Make sure that you have free memory available. Enough free memory so that around half of the server’s memory is being used for in-memory buffers and cache, rather than swapping and paging to disk. Of course, this ratio will differ case by case. Therefore, be sure you are not swapping and kernel cache pressure isn’t high due to a lack of free memory.
- Tweak your system, storage device(s), and the Linux kernel for increased storage performance and lifespan.
- Finally, if all else fails, upgrade storage devices to faster SSD, NVMe, or other high-throughput storage devices.
Conclusion
Understanding and managing I/O wait (iowait) is crucial for maintaining the optimal performance of Linux servers. Iowait represents the percentage of time that the CPU is idle while waiting for pending disk I/O requests, making it a valuable metric in system monitoring. However, interpreting iowait requires careful consideration of your server’s workload and application performance.
It’s important to note that high iowait doesn’t always indicate a problem, as modern storage solutions may inherently be slower than CPU performance. The key is to investigate further and assess the impact on end-user experience, database queries, and overall application health.
To effectively monitor and address I/O wait related issues, you can utilize various tools such as atop, iostat, iotop, pstree, ps, strace, and lsof. These tools help identify the processes responsible for high iowait and provide insights into potential optimizations.
Reducing I/O wait involves optimizing your application’s code and database queries, keeping your Linux system and software up-to-date, ensuring sufficient free memory, and tweaking system and storage settings. In extreme cases, upgrading to faster storage devices like SSDs or NVMe can significantly improve performance.
In addition to the tracing tools mentioned above, we can use observability and benchmarking tools to put together a complete picture of the system’s overall I/O performance. Your main goal should be to reduce or eliminate any iowait directly resulting from waiting for storage-related I/O.
Published: Aug 19th, 2020 | Last updated: January 5th, 2026.
Update: This article was originally published back in 2020. Recently more and more modern systems use fast NVMe storage, and as such, elevated iowait does not always indicate a storage bottleneck. In many cases, the storage subsystem is no longer the bottleneck, and elevated iowait instead coincides with CPU-side constraints such as scheduling delays, interrupt pressure, or inefficient application behavior, rather than storage contention.
As a result, iowait should always be evaluated alongside latency, queue depth, and application-level performance.