Diagnosing Swap Usage with smem on Linux
If you’ve ever looked at your server and wondered why it’s using swap even though plenty of RAM is available, you’re not alone. This is a common scenario on Linux systems, and it can impact performance if not addressed. One of the most useful tools for digging into this issue is smem, a memory reporting tool that shows proportional memory usage per process, including swap.
Why Swap Gets Used
Linux is designed to be efficient with memory, often using RAM for things like file caching. However, when the kernel decides that some memory pages haven’t been accessed in a while, it may move them to swap space, even if there’s still free RAM available. This behavior is influenced by settings like vm.swappiness, but before tweaking kernel parameters, it’s crucial to know what is actually using swap.
Also read: Linux Performance: Almost Always Add Swap Space.
Installing smem
smem isn’t usually installed by default, but it’s available in most package repositories.
On RHEL/CentOS/Alma/Fedora:
dnf install smem
On Debian/Ubuntu:
apt install smem
Basic Usage
Once installed, you can sort processes by swap usage like this:
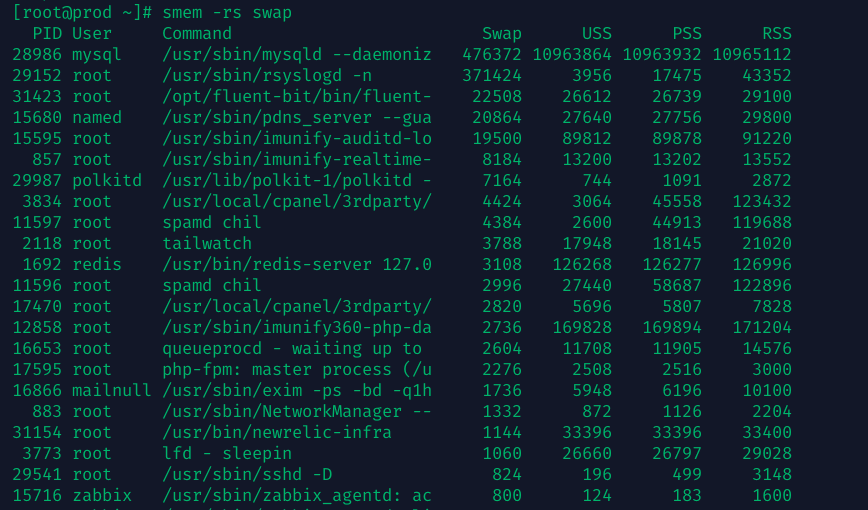
smem -rs swap
This will output a table of processes, sorted by the amount of swap used, with additional columns for USS (Unique Set Size), PSS (Proportional Set Size), and RSS (Resident Set Size).
Example Output (Truncated):
   PID User    Command                          Swap      USS       PSS      RSS
28986 mysql    /usr/sbin/mysqld --daemoniz    476372 10963864  10963932 10965112
29152  root    /usr/sbin/rsyslogd -n          371424     3956     17475    43352
31423  root    /opt/fluent-bit/bin/fluent-     22508    26612     26739    29100
From this, we can clearly see that mysqld and rsyslogd are consuming significant swap.
What to Do Next
You should tune memory-heavy services like MySQL, rsyslog. Take a look at the MySQL Monitor script. Once you’ve addressed swap-heavy processes, consider reducing swappiness:
sysctl vm.swappiness=1
echo 'vm.swappiness=1' >> /etc/sysctl.conf
Also read: Linux server needs a RAM upgrade? Check with top, free, vmstat, sar.
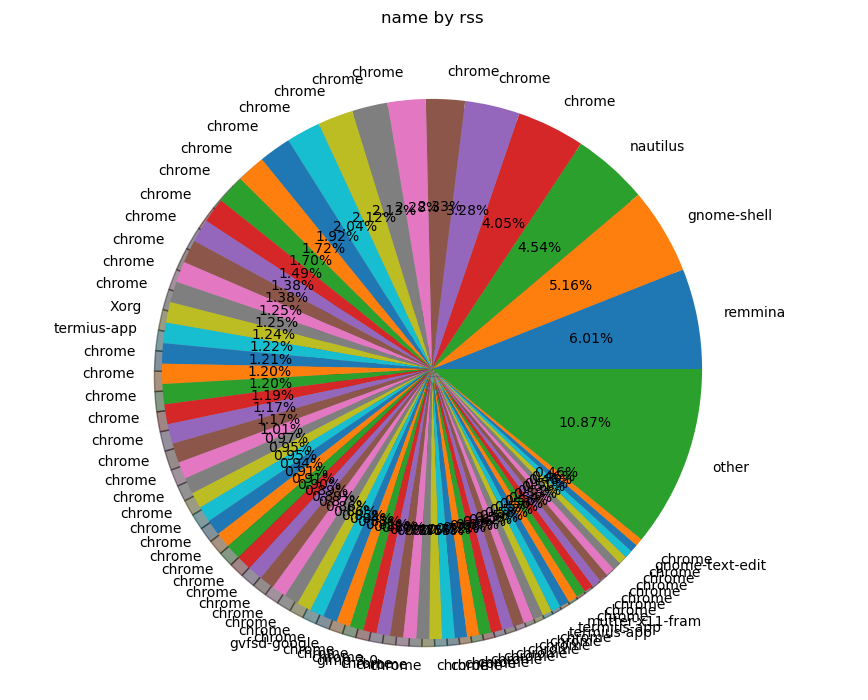
With smem you can even generate a pie chart! For example, on my desktop: smem --pie name -s rss:
Conclusion
smem is a lightweight but powerful tool that gives you visibility into real memory and swap usage per process. It’s especially useful when trying to understand why a seemingly idle server is dipping into swap. Pair it with tuning vm.swappiness, vfs_cache_pressure, and careful service profiling to keep your systems running smoothly.

So here are a few other tools, similar to
smem, that I make use of often. They all report per-process memory usage with varying levels of detail, and some also help identify swap-heavy processes:procps-ngtools (top,htop)htopshows RES, VIRT, and SWAP columns interactively.htopby enabling theSWAPcolumn (F2 > Columns > AddSWAP).atoptopbut logs system resource usage over time.mto see memory metrics per process.glancessmem.Let me know if you’re interested in GUI tools or logging-capable daemons for long-term memory profiling. Ironically one of the best alternatives to
topisbottom.There’s also…