bottom (btm) – A Comprehensive System Resource Monitor
Today, I learned about bottom – yet another command line process/system monitoring tool. I’m probably late to this one; however, I want to quickly share this tool with readers.
Have you ever found yourself needing a detailed and real-time overview of system resource usage on your server or computer? Specifically for Linux, there are various options, each offering its unique set of features. From top, htop, to btop, the list is endless. However, one tool that stands out for its comprehensiveness and efficiency is btm, also known as bottom.
Meet bottom
bottom (run using btm) is an alternative to top that aims to be lightweight, cross-platform, and more graphical than top. bottom is a feature-rich system resource monitor that provides an extensive view of processor, memory, disks, network, and processes. bottom is a versatile terminal-based utility designed to make monitoring your system’s performance a breeze.
 - A Comprehensive System Resource Monitor")
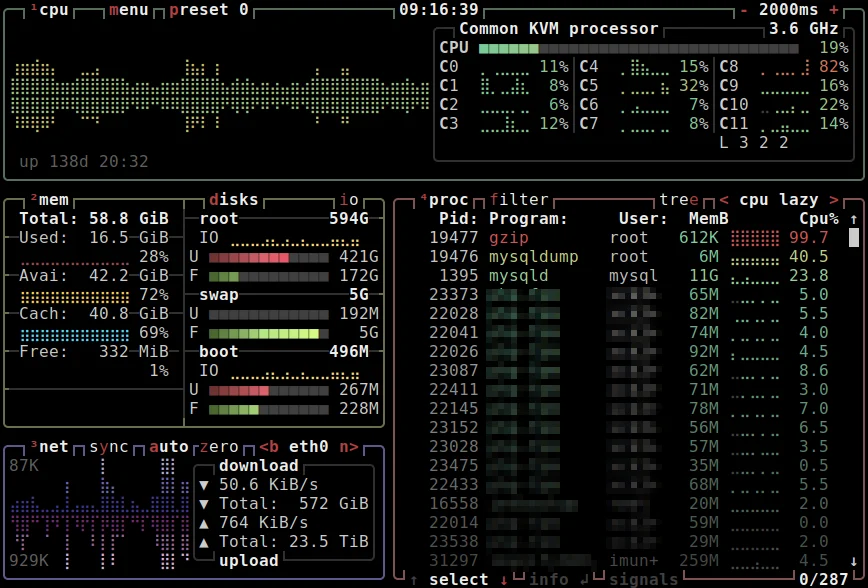
Screenshot of btm from Kali-i3, on my Thinkpad T14s.
What I like about Bottom is that it is very efficient on system resources compared to similar ‘fancy’ system monitoring tools like glances or even btop.
Using bottom
Listed below are some valuable keyboard shortcuts to help you navigate bottom. To access the full list of keyboard shortcuts, simply press the ‘?‘ key within the bottom interface:
")
Key Features of bottom
- Process Management: You can sort, filter, and manipulate processes right from the bottom interface, making it easy to identify and manage resource-intensive applications.
- Resource Overviews: It provides an overview of essential system resources like CPU, memory, disk, and network usage. This is useful for quickly spotting performance bottlenecks.
- Interactive Interface: bottom offers an intuitive TUI (Text-based User Interface) that allows you to navigate through various system statistics easily. bottom is highly customizable. You can configure which columns to display, change color schemes, and save your preferences for future use.
Practical Uses of bottom
- Resource Monitoring: Use bottom to keep an eye on your system’s resource utilization, especially in situations where your system might be stressed.
- Troubleshooting: When your system is slow or unresponsive, bottom can help you identify resource-hungry processes and take necessary actions, like terminating a misbehaving application.
- Server Monitoring: On headless servers, bottom provides a convenient way to monitor performance without the need for a graphical environment.
Taking Monitoring to the Next Level
While bottom provides an extensive overview of your system’s performance, it’s worth noting that it’s just one piece of the puzzle. For those serious about optimizing their applications and ensuring the best user experience, consider setting up APM and observability tools.
APM solutions provide in-depth insights into how your applications are utilizing system resources and impacting the user experience. Observability empowers you with the data you need to make informed decisions about code optimization and hardware upgrades.
Conclusion

bottom stands out as a comprehensive and powerful tool for power users and sysadmins. With its extensive feature set and graphical visualizations, it provides an in-depth view of system performance, making it a valuable addition to your toolkit.
Whether you’re a developer, sysadmin, or simply a Linux enthusiast, btm can help you gain deeper insights into your system’s resource utilization. If you haven’t already, give it a try and unlock a new level of understanding of your system’s performance.
Published: October 24, 2023 | Updated: Feb 1st, 2025

Nifty tool where do I get it? It’s not in Debian’s Repos

Oops! I thought I included a link: bottom: cross-platform graphical process/system monitor.
Will update the article. Thanks!!
Updating this article. it came full circle. Originally posted Oct 2023.
So since I moved from i3 to Gnome via full reinstall, I didn’t save dot files or notes about bottom. For the life of me, I just could not remember the name of this tool. Then noticed it here, not even remembering that I shared it. But glad I found this tool again, it’s pretty good!
It’s also very useful for monitoring temps, including GPU temps:
With all these local LLMs like DeepSeek and others, it comes in handy!