Are you measuring Linux web server memory usage correctly?
This article was first published in 2014. After which, there was a welcomed change to the Linux kernel in 2016, as mentioned in the 2017 article: Does your Linux server need a RAM upgrade? Let’s check with free, top, vmstat and sar.
As a server administrator or web developer, it’s your responsibility to stay informed about the latest developments in memory management. Ensure that your chosen tools provide a precise view of your server’s memory usage, and adapt your strategies accordingly.
Remember that Linux memory management is a dynamic field, and what held true in the past may not be the best practice today. Stay vigilant, keep your systems updated, and embrace the ever-improving capabilities of Linux to make the most of your server’s resources.
As outlined here, memory is now marked as available by the Linux kernel:
“Estimation of how much memory is available for starting new applications, without swapping. Unlike the data provided by the cache or free fields, this field takes into account page cache and also that not all reclaimable memory slabs will be reclaimed due to items being in use (MemAvailable in /proc/meminfo, available on kernels 3.14, emulated on kernels 2.6.27+, otherwise the same as free).”
kernel.org: /proc/meminfo: provide estimated available memory: “Many load balancing and workload placing programs check /proc/meminfo to estimate how much free memory is available. They generally do this by adding up “free” and “cached,” which was fine ten years ago but is pretty much guaranteed to be wrong today.
It is wrong because Cached includes memory that is not freeable as page cache, for example, shared memory segments, tmpfs, and ramfs. It does not include reclaimable slab memory, which can take up a large fraction of the system memory on mostly idle systems with lots of files.
Currently, the amount of memory that is available for a new workload, without pushing the system into swap, can be estimated from MemFree, Active(file), Inactive(file), and SReclaimable, as well as the “low” watermarks from /proc/zoneinfo.
However, this may change in the future, and user space really should not be expected to know kernel internals to come up with an estimate for the amount of free memory. It is more convenient to provide such an estimate in /proc/meminfo. If things change in the future, we only have to change it in one place…” – Source https://git.kernel.org
That said, the core principles outlined in this article regarding Linux server memory management remain relevant and applicable today. As such, it largely remains unchanged.
Original article
Does the screenshot below from New Relic look familiar to you? Let’s say you have a web server with 2 GB of RAM or maybe even 256 GB of RAM. Your web apps are running slowly, so you check New Relic and other server monitoring and APM tools but, unfortunately, don’t see any red flags.
The swap seen below may worry you a little, but you say: “Hey, there’s plenty of free memory, right!?” Technically, yes, but as it relates to Linux web server performance, no, absolutely not. Let’s discuss.

Old screenshot from New Relic’s UI back in 2014. See the revised 2022 New Relic memory usage screenshot below.
Linux: Desktop Memory Usage vs. Web Server Memory Usage
You may be running Ubuntu, Arch, Debian, or maybe Fedora on your Linux-based home computer or laptop. Currently, my laptop shows 5 days, 11 hours, and 2 minutes of uptime. I use the standby feature a lot and have been up for 30+ days before. I mention this because if you keep your system running for days, weeks, or longer, that has some advantage in memory usage.
Let’s say you have 8 GB of installed ram on your laptop, and earlier today, you used GIMP (image editor), Chrome, and LibreOffice. Chances are, unless you perform heavy computing using other applications afterward (or restart your system), Linux will keep a lot of the required files and paths cached and buffered to RAM (memory).
This is very useful because if, for some reason, you decide to re-edit photos, browse the web again, or open a new file in LibreOffice, all of these tasks will open and function noticeably faster the second time around.
This is because they were cached (temporarily saved) to memory. Over time, you may not use GIMP or LibreOffice for a while, and gradually, the Linux kernel will replace those cached files with data from your new apps. This is perfectly fine and encouraged because you don’t need to keep unused files stored in memory, especially if you don’t have any system memory to spare.
However, Linux servers are different, very different. The same files are requested repeatedly at varying rates throughout the day. Often, files are requested several times per minute or even per second on busier servers. So, how often do you want those files and paths removed from the cache?
With Linux web servers, we want cached (and buffered) data to be kept as long as possible. Long enough that the cache pressure for removing files to make room for newer files isn’t causing the Linux kernel to favor serving files from swap (much slower disk storage) rather than from cached memory.
Example: measuring memory usage incorrectly
Looking at the below revised 2022 memory usage screenshot from New Relic, most of the so-called “Memory Free” is memory used for system caching and buffers:
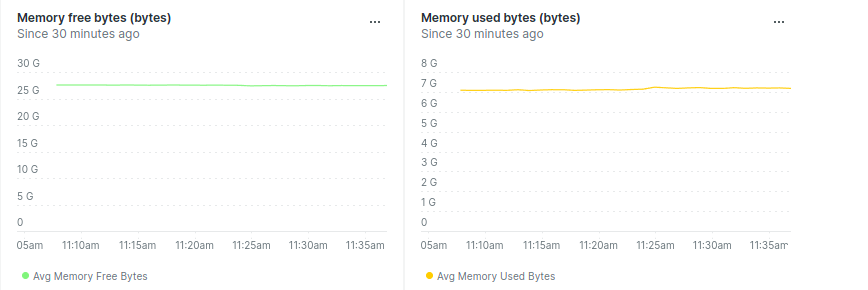
New Relic’s memory usage graphs as of May 2022.
Now, compare New Relic’s “Memory Free” and “Memory Used” with btop command-line system monitor and the free -m command on the same server:
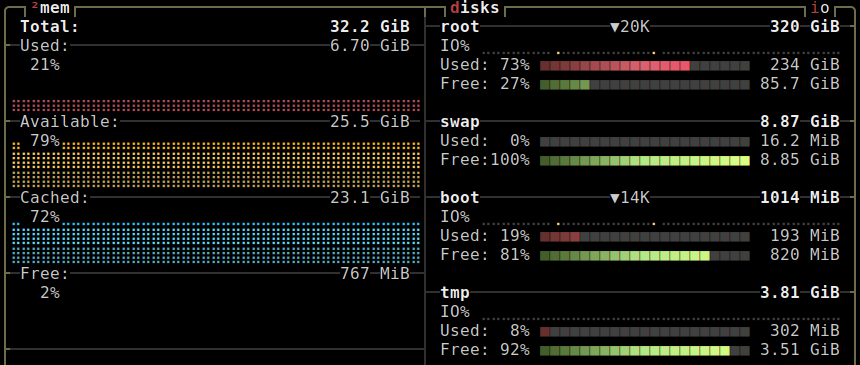
btop correctly shows that “free” memory is 2%.
The system is healthy because 79% of the memory is used for cache, buffers, and other functions that can be freed without the need to swap. As such, the server is using ~ 0% swap.

The free -h command also matches the findings of btop. This means New Relic’s method for displaying free memory should probably be revised.
Note that cached memory is the amount of memory used to keep copies of actual files in RAM. When there are files that are constantly being written or read, having these in memory reduces the number of times you need to operate on the physical hard disk; as a result, you can significantly improve Linux performance by using memory for cache.
The man free command defines available memory this way: “Estimation of how much memory is available for starting new applications, without swapping.”
Even on SSDs (solid-state drives), disk storage is tremendously slower than RAM!
The command ‘free’ will never let you down!
As touched on above, using the free command or (or free -m or free -h) will reveal how your system memory is being allocated. See this example below from Red Hat’s docs:
$ free
              total       used        free    shared    buffers    cached
Mem:        4040360    4012200       28160         0     176628   3571348
-/+ buffers/cache:      264224     3776136
Swap:       4200956      12184     4188772
Notice there’s 28160 KB “free.” However, below that line, look at how much memory has been consumed by buffers and cache! Linux always tries to use memory first to speed up disk operations by using available memory for buffers (file system metadata) and cache (pages with actual contents of files or block devices). This helps the system run faster because disk information is already in memory, thus saving I/O operations. If more space is required, Linux will free up the buffers and cache to yield memory for the applications. If there’s not enough “free” space, the cache will be saved (swapped) to disk. It would be wise to monitor this and keep swap and cache contention within an acceptable range that does not affect performance. — Also, read Red Hat’s tuning and optimizing guide.
Have a look at the screen capture below. Remember that the white/unshaded area (under “Physical memory”) is primarily used by cache and buffers, which your web server depends on to maintain that blazing-fast performance you crave. Notice the effect of swapping in this case: increased disk IO latency, which causes blocking of CPU’s performance and io wait.
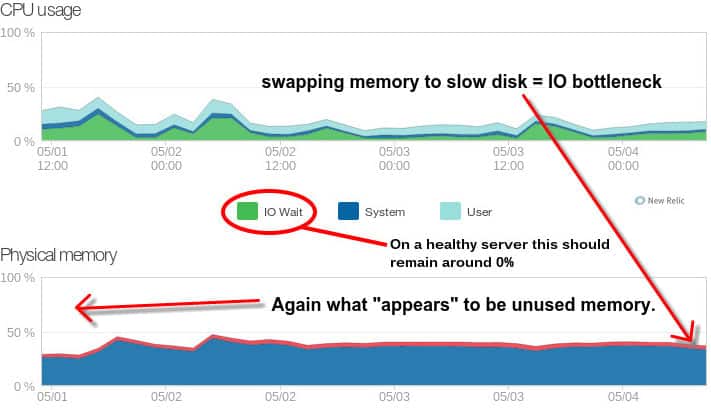
The fix for this web server at the time didn’t involve a memory upgrade but instead recovering memory by reconfiguring MySQL, which had been misconfigured in the direction of larger is always better (Update: MySQL query cache is deprecated as of MySQL 5.7.20, and is removed in MySQL 8.0) and also by removing a bunch of unused MySQL databases.
Now, please don’t take away that I’m suggesting to “eliminate” swap completely. :) No. Swap has its place and purpose. Instead, it would be best to find that balance whereby swapping does not get in the way of throughput/performance. There are many tools and services to monitor web server memory usage.
The previous graph may be misleading to those who depend on the percentage unused in decision-making. Whenever there’s constant swapping, make sure to investigate server health!
The man free command defines available memory this way: “Estimation of how much memory is available for starting new applications, without swapping.”
Swapping is not always bad!
Opportunistic swapping is helpful to performance! This is when the system has nothing better to do, so it saves cached data that hasn’t been used for a long time to disk swap space. The cool thing about opportunistic swapping is that the server still keeps and serves a copy of the data in physical memory.
Later, things get hectic, and the server needs that memory for something else; it can remove them without performing additional untimely writes to disk. That’s healthy!
That said, if you have tons of RAM, there will be less swapping. For example, the below 64 GB server has been up for 60+days with 5 GB of free memory (approximately 8%), no swap used:
root@server [~]# free -m
             total       used       free     shared    buffers     cached
Mem:         62589      57007       5582          0       1999      31705
-/+ buffers/cache:      23302      39287
Swap:         1999          0       1999
Here’s what 8% free memory looks like on New Relic:
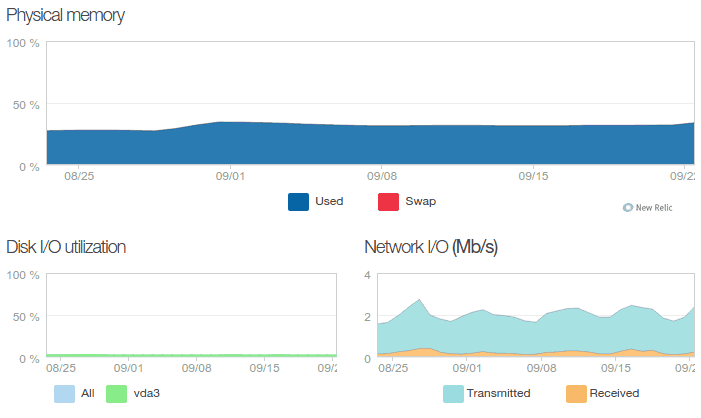
Disk IO utilization seen here is good.
Graphing Linux web server memory usage with Munin
Lastly, let’s look at Munin’s open-source monitoring tool. In the graph below, Munin labeled cached memory as “cache”. In this example, the server is healthy, and swapping does not affect performance because the size of cache and buffers is reasonably large enough for the kernel to swap out to disk selectively. The ratio of used memory to cached/buffered memory shows that this server is caching more than three times the memory “used.”
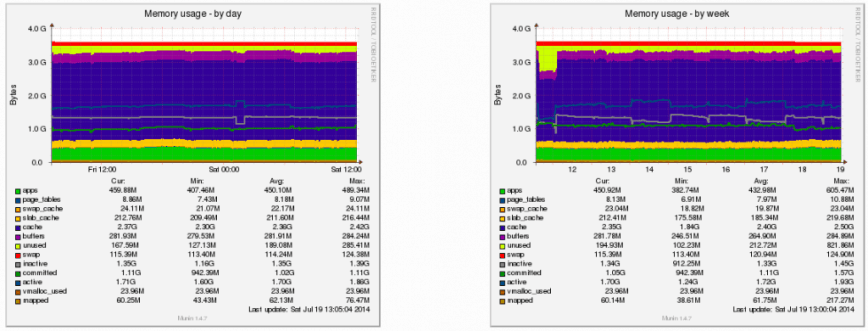
There’s no hard rule for the recommended size of the cache on web servers. It will vary case by case. That said, if 50% or more of your RAM used by cache is great for performance! You don’t want a ton of free memory sitting around doing nothing.
Now another example: a 30 GB web server, no swapping. We could probably play with kernel and sysctl configuration here:
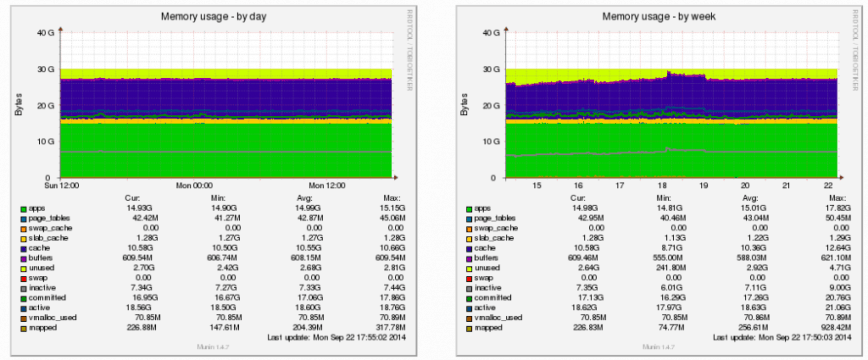
Remember, unlike Linux desktops, with web servers, a much higher percentage of previously accessed files are repeatedly requested. So, while considering cached memory as “free” on a desktop install may be ok, that’s not the case with web servers. Let’s keep them cached!
Many observability vendors and tools correctly calculate cached memory and free memory. Check them out!
Another example of counting cached/buffered memory
Last month, a server suffered a MySQL failure due to memory being exhausted. Here’s the Munin report of memory usage:
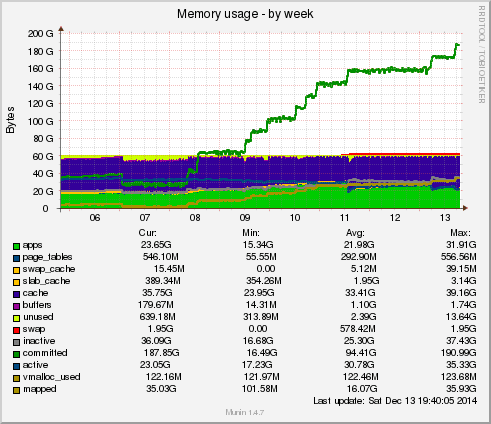
Here’s New Relic’s report on memory usage for the same period. It shows swapping but also a healthy amount of memory free (white space) and only a peak of about 50% used:

The server owner was thus unaware of the extent of the problem. These style of memory usage graphs — also the updated 2022 New Relic graphs — might be misleading to some. So, Are You Measuring Linux Web Server Memory Usage “Correctly”? I’ve also written a more concise article on this topic: Free vs. Available Memory in Linux.
Conclusion
While the core principles of memory management in Linux remain steadfast, the landscape has seen subtle shifts over the years. Kernel enhancements, updates to monitoring tools, and shifts in server workloads have all contributed to this evolution.
The key takeaway here is that accurate interpretation of memory metrics is paramount. Relying solely on outdated or misleading indicators can lead to misinformed decisions and potentially suboptimal server performance.
In this digital age where server performance can make or break online experiences, accurate memory management is your compass through the maze of challenges. Whether you’re running a personal blog or managing a mission-critical web application, understanding and optimizing memory usage is your ticket to a faster, more reliable, and more efficient server environment.
Published: 2014 / Last updated: January 9th, 2025