Why Your Linux Server “Looks Idle” but “Feels” Slow
Servers can sometimes appear idle yet still perform sluggishly. This scenario is common across web hosting servers, database servers, VPS or cloud instances, or even containerized workloads. In all mainstream Linux distributions, the core reasons and diagnostics are similar. Below, we explain why an “idle” server might be slow and how to diagnose the real bottlenecks.
Understanding the Idle-but-Slow Scenario
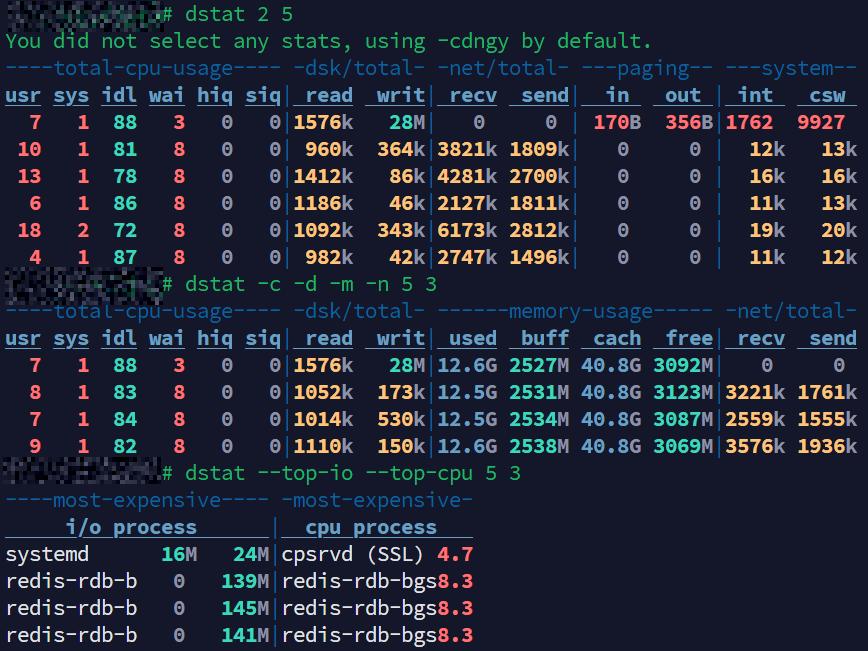
dstat example: CPU is mostly idle (%idl > 80%), but Redis background writes (redis-rdb-b) are generating disk I/O. %wai stays at 8%, showing the CPU is waiting on disk. A classic case where the server looks idle but feels slow.
When a server looks idle (for example, CPU usage is low) but feels slow to users, it usually means the bottleneck isn’t the CPU. In my experience, it usually comes down to a few familiar culprits. Most of the time it’s disk or storage bottlenecks, a single-threaded workload pegging one core, or something like lock contention causing a pile-up of context switches. Other factors like memory pressure/swap or network delays do happen, but they’re less common and usually easier to spot. Starting with those first three will often save you time.
Here are the most common bottlenecks that can make a server feel slow even when it looks idle:
Disk I/O Wait or Storage Bottlenecks
One of the most common culprits is the storage subsystem. The CPU may be mostly idle because it’s waiting for disk operations to complete (high I/O wait time). In this state, processes are often stuck in uninterruptible sleep (marked as D state in Linux), awaiting data from disk. This can happen if the disk is slow or saturated with too many requests (for example, a busy database writing to disk, or a logging process performing large writes).
The CPU spends time “twiddling its thumbs” waiting for data, so overall CPU usage stays low, but everything moves slowly. High I/O wait often shows up as an elevated %wa in tools like top or vmstat (indicating the percentage of time the CPU is waiting on I/O). Disk bottlenecks can be due to slow drives, high latency storage, or a backlog of queued requests on the storage device.
Memory Pressure and Swapping
Another common cause is insufficient memory leading to swap usage. If your server is low on RAM and starts swapping to disk, even simple operations can become slow (because disk is much slower than RAM). The CPU might not be busy (hence “idle”) because processes are paused waiting for memory pages to load from swap or flush to disk.
In such cases, you may observe high disk activity (as the system swaps) and possibly high I/O wait as well. Even without swap, if memory is very tight, the system might spend extra time trying to free memory (e.g. shrinking caches), making things sluggish without maxing out CPU or load levels.
Network or External Resource Delays
If your server depends on external resources (like an API call, a database on another host, or an NFS file share), it might be idle locally while waiting for those responses. For example, a web server process could be waiting on a database query to return; during that wait the CPU usage is minimal, but from the end-user perspective the request is slow. Similarly, high network I/O or latency can make a server respond slowly even though its own CPU is not taxed.
Single-Threaded Bottlenecks
Many servers have multiple CPU cores. If a workload is bound by a single thread (single core), it might saturate that one core while others remain idle. The aggregate CPU usage could appear low (e.g. one core at 100% on a 8-core system is ~12% overall), giving the impression of an idle system. However, that one busy core becomes a bottleneck, and tasks handled by that thread are slow. This often happens with certain database operations or applications that aren’t optimized for concurrency. When applications can’t leverage multiple threads, faster single-core performance matters more than CPU core count. Also read: PHP Performance: Additional CPU cores vs Faster CPU cores.
Lock Contention or Context Switching Overhead
In some cases, the slowdown is due to processes contending for locks or constantly context-switching. If threads frequently wait on locks (for example, many worker threads all waiting for a single shared resource), the CPU might be mostly idle (since at any given time most threads are waiting). Throughput plummets because of the waiting, not because of raw CPU exhaustion. Similarly, excessive context switching (perhaps due to too many processes or interrupts) can introduce overhead that isn’t obvious as high CPU usage in one process. The system may look idle but spends a lot of small time slices shuffling between tasks, which adds latency.
Virtualization Overhead (CPU Steal Time)
On virtual private servers or cloud instances, your guest OS might show low CPU usage while the underlying host is busy. In these cases, you might see high steal time (shown as %st in CPU stats) – indicating the hypervisor is taking CPU time away for other tasks/VMs. To the guest OS, it appears as if the CPU was idle (nothing running), but in reality your VM was simply not scheduled to run. This can make the VM slow despite “idle” readings.
Diagnosing the Problem: Key Tools and Commands
The bottom line is, as sysadmins, the key is to identify what resource is bottlenecked or which process is causing waits. This article serves as a supporting article to past articles that provide guidance on using other tools such as top, htop, atop, etc. Here are a few:
- btop – the htop alternative.
- 90 Linux Commands Frequently Used by Linux Sysadmins (Now 100+).
- iotop command in Linux w/ examples.
- atop for Linux server performance analysis (Guide).
- htop: Quick Guide & Customization.
- htop and top Alternatives: Glances, nmon.
- Linux Troubleshooting: These 4 Steps Will Fix 99% of Errors.
- Linux top: Here’s how to customize it.
We will walk through four powerful tools – vmstat, pidstat, dstat, and iotop – and show example commands that help uncover why your server feels slow. These four tools are available on mainstream Linux distros (you may need to install some via your package manager if not already present). The general approach is:
- Use broad system monitors (vmstat or dstat) to check overall system metrics (CPU idle vs. wait, memory usage, disk throughput, etc.). These will reveal if resources like disk or memory are under pressure.
- Use more specific tools (pidstat and iotop) to pinpoint which processes are contributing to the problem, such as a process doing heavy I/O or one consuming a lot of memory or causing context switches.
Using vmstat for a System Overview
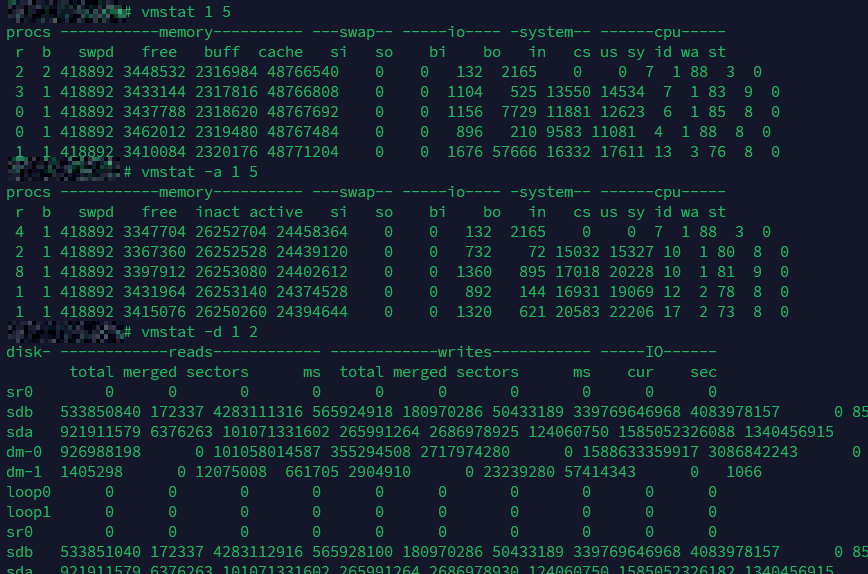
vmstat example: CPU shows high idle time and minimal I/O wait, memory usage is stable with no swapping, but steady block I/O (bo) activity and large cumulative disk writes (sda, sdb) suggest ongoing disk operations.
The vmstat (virtual memory statistics) tool provides a quick snapshot of system-wide resource usage: it reports on processes, memory, swap, I/O, and CPU in each sample. This makes it great for seeing things like I/O wait and swapping activity at a glance. By default, running vmstat with a delay will show fields such as: – r (runnable processes), b (blocked processes waiting for I/O), – memory stats (free memory, buffer, cache), – si/so (swap in/out per second), – bi/bo (block device I/O reads/writes per second), – and CPU usage breakdown: %us (user), %sy (system), %id (idle), %wa (wait), %st (steal).
Here are some actionable vmstat commands and what they do:
Basic real-time snapshot:
vmstat 1 5
This command will print system stats every 1 second, for 5 iterations. The first line of output is an average since boot (you can ignore that), and subsequent lines are per-second samples. Look at the cpu columns: if you see a high number under wa and a low number under id, it means a lot of CPU time is waiting on I/O. Also check the b column (blocked processes); a non-zero b indicates processes stuck waiting (often on disk I/O). For example, an output line showing something like id 70 wa 30 means 30% of CPU time was spent waiting on I/O during that sample – a strong hint that disk (or possibly network I/O) is the bottleneck. If instead you see si and so values greater than 0 consistently, that means swapping is occurring (memory pressure). The r column (run queue length) significantly higher than the number of CPUs with low CPU usage could indicate many threads are waiting (possibly on I/O or locks).
Include active/inactive memory info:
vmstat -a 2 3
The -a flag adds columns for active and inactive memory. This command takes 3 samples at 2-second intervals. This is useful to see how memory is being used. If most memory is “active” (in use) and very little is “inactive” (available for cache or easily reclaimable), the system might be memory bound even if it’s not yet swapping. A high active memory and low free memory means the server is using almost all RAM for applications and cache – which is normal up to a point. But if you also notice rising si/so (swap in/out), then memory exhaustion is causing slowdown. In an idle-but-slow scenario, if vmstat -a shows that free memory is near zero and swap is active, the slowness could be due to constant memory swapping.
Disk I/O statistics focus:
vmstat -d 1 5
Using vmstat -d will display disk I/O stats. In this mode, vmstat reports cumulative disk reads/writes and I/O statistics for each block device. When combined with a sampling interval (here 1 second) and count, it shows how these values increase over time. Each line of output over the 5-second span will show how many reads (# of reads, # of sectors read) and writes have occurred on the disks in that interval. For instance, if you observe hundreds of sectors or a large number of blocks being written per second, it indicates heavy disk activity. This can confirm that even though CPU is idle, the disks are busy. High disk read/write throughput correlates with high I/O wait. This command helps differentiate whether the disk activity is continuous and heavy during the period of slowness. (Note: You might need to scroll or adjust terminal width, or use vmstat -w for wide output, to see all columns properly.)
Using pidstat for Per-Process Metrics
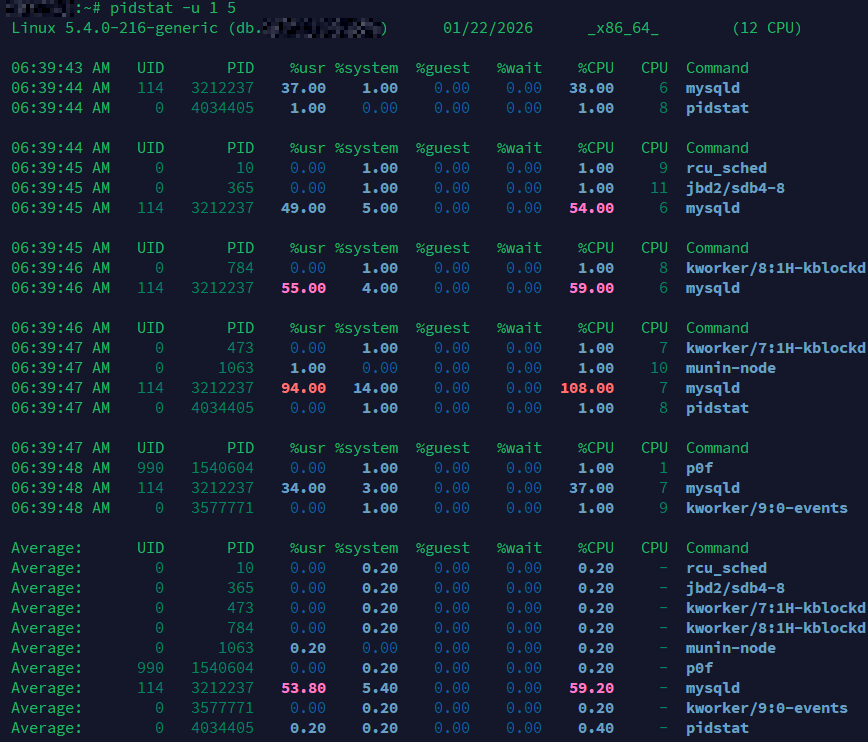
Example: pidstat shows a mysqld thread periodically spiking to 94–108% CPU usage on a single core, while other processes remain idle. MySQL is multi-threaded, but a single long-running query or thread can still become CPU-bound. This is a case where thread-level contention or lack of parallelism becomes the bottleneck.
While vmstat looks at the system as a whole, pidstat (part of the sysstat package) allows you to monitor resource usage per process. This is extremely helpful to find out which process is causing the trouble (for example, one rogue process doing heavy I/O or consuming memory). You can use different options with pidstat to focus on CPU, disk I/O, memory, etc., on a per-process basis. By default, pidstat will show CPU usage of processes at given intervals, but we can specify flags for other metrics:
CPU usage per process:
pidstat -u 1 5
This will report CPU usage (-u) for every running process, across 5 samples at 1-second intervals. Even if overall CPU is low, this can highlight if a single process occasionally spikes the CPU or if any process is consuming an unusual amount of CPU in short bursts. In an idle-but-slow scenario, you might not see any high CPU here (which is fine), but it’s good to confirm that no process is secretly hogging a CPU core. The output will list processes with fields like %usr, %system, and %CPU per process. If one process shows a high %CPU at times while others are near zero, it might indicate a single-thread bottleneck or a periodic job causing slowdowns.
Disk I/O usage per process:
pidstat -d 1 5
The -d flag tells pidstat to report disk I/O statistics per process. Over 5 iterations (1-second apart), it will show columns such as kilobytes read and written per second (kB_rd/s, kB_wr/s) for processes, as well as iodelay (the amount of time processes were delayed due to IO). This is extremely useful to find out which process is doing heavy disk reads/writes. For example, if during a slow period you see a process like mysqld or java with a very high kB_wr/s or kB_rd/s, that process is likely saturating the disk. Even if the CPU usage of that process is low, its heavy I/O can make the entire system slow. The iodelay column shows how much time (in clock ticks) the process was waiting on I/O – large values here confirm that the process spent time blocked on disk operations. In our “idle but slow” scenario, you might find one process with high disk throughput or I/O delay, explaining why the CPU was idle (it was waiting on that process’s I/O).
Memory and paging per process:
pidstat -r 1 5
Use the -r option to monitor memory usage and paging stats for processes. This will output metrics like the process’s virtual memory size (VSZ), resident set size (RSS), and more importantly the rate of minor and major page faults (minflt/s and majflt/s). A high rate of major faults indicates the process is reading memory from disk (which happens when data is not in RAM, i.e., page faults that require disk I/O, potentially due to swapping or lazy loading of memory). If a particular process shows non-zero majflt/s consistently and the server is slow, it suggests that process is constantly hitting the disk to fetch memory pages (perhaps its working set doesn’t fit in RAM). For instance, if pidstat -r shows one process with large RSS close to total RAM and a steady stream of major faults, that process is likely causing swap activity and slowing the system. Monitoring memory per process helps identify if one app is consuming most of the RAM or if it’s suffering from memory thrashing.
You could also try pidstat -w 1 5 to examine task switching (voluntary/involuntary context switches per process). A very high number of voluntary context switches in a process might imply it’s spending time waiting (perhaps on I/O or locks), while high involuntary switches could indicate heavy CPU contention or frequent preemption. This can be useful if lock contention is suspected.
By using pidstat, you correlate system slowness to specific processes. For example, you might discover “Process X is writing 5 MB/s to disk and has high IO wait” or “Process Y is causing a lot of page faults.” This directs you to investigate that particular service or application (maybe it’s misconfigured, or needs optimization, or indicates an underlying hardware issue for that resource).
Using dstat for Combined Statistics
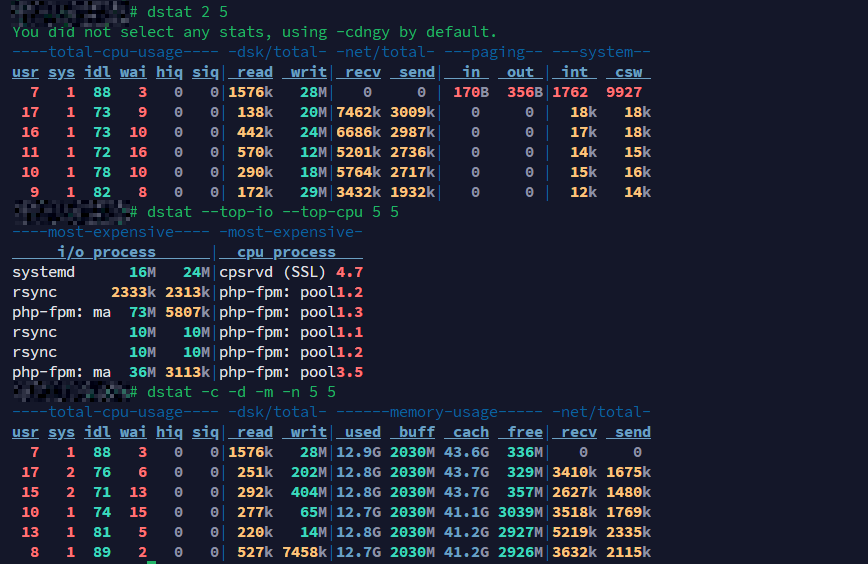
dstat example: CPU is mostly idle, memory is fine, but heavy disk activity from rsync and php-fpm causes I/O wait (%wai) and could impact web app responsiveness despite a system that “looks idle.”
dstat is a versatile real-time system statistics tool that can display a bit of everything in one view. Think of it as an enhanced version of vmstat/iostat/netstat combined. By default, dstat shows CPU, disk, network, paging, and system (interrupts, context switches) all at once, updated in real time. This holistic view is helpful to catch interactions between resources. For instance, you can observe if high disk writes correspond with network activity or if there’s a lot of paging (which would show up under page stats and disk).
Example dstat usages:
Default view (CPU, disk, net, etc. at once):
dstat 2 5
Running dstat with an interval (here 2 seconds) and count (5 updates) will, by default, show a wide table of stats. It typically includes: CPU usage (user, system, idle, wait, steal), disk read/write, network receive/send, paging (page in/page out), and system interrupts/context-switch. This single command can confirm a lot: for example, you might see in one of the columns that disk writes (writ) are high during each interval, while %idl (idle) is also high but %wai (wait) is non-zero. That’s a sign the system is writing to disk heavily and the CPU is waiting on it. Or you may observe that recv/send (network) are minimal, ruling out network as an issue. The paging columns (in, out) show if the system is moving memory pages to/from disk (swap). If you see non-zero paging out (out), that means memory pressure (pages are being swapped out). All this in one view helps cross-check the theory: e.g., dstat might show 0% idle, 50% wait, heavy disk writes, and some page-outs – clearly indicating the server is slow due to I/O and memory factors, not CPU.
Custom focus on specific stats:
dstat -c -d -m -n 5 3
This command tells dstat to show cpu, disk, memory, and network stats, with 5-second intervals, 3 times. The output will be narrower than the default (only those four categories). Under CPU you’ll see how much is idle vs waiting; under disk, the total read/write per interval; under memory, things like used/free memory (and possibly swap used); under network, the total traffic. By increasing the interval to 5 seconds, you get a sense of sustained activity rather than per-second spikes. Use this when you want to specifically monitor memory usage along with CPU and disk over a brief period. For instance, if the memory used jumps each sample and free memory drops or swap usage grows, you know memory is filling up. Coupled with disk writes, it could indicate swapping. If network columns show nothing significant, you can likely exclude network latency as a major factor.
Including top processes (optional advanced usage):
dstat --top-io --top-cpu 5 3
Dstat has “top” plugins that can list the most resource-intensive processes for certain metrics. The above command, for example, will show the top I/O consuming process and top CPU consuming process every 5 seconds (for 3 iterations), alongside overall totals. This is a quick way to catch, say, which process is doing the most disk I/O while your server is slow. If you see a specific process name under Top IO consistently, that’s your likely culprit. (Ensure you run dstat as root for the top process stats to work, since it may need permission to gather per-process info.) This usage can combine the benefits of an overview and per-process insight in one tool. If you’re not comfortable with this, you can achieve a similar result by running dstat in one terminal and iotop/pidstat in another.
Overall, dstat is great for a broad overview and spotting co-occurring events. It’s especially useful when you’re not sure where the bottleneck is – it helps you watch CPU, disk, network, memory all together. Once you suspect one (e.g., disk or memory), you can zoom in with other tools.
Using iotop to Trace I/O Hogs
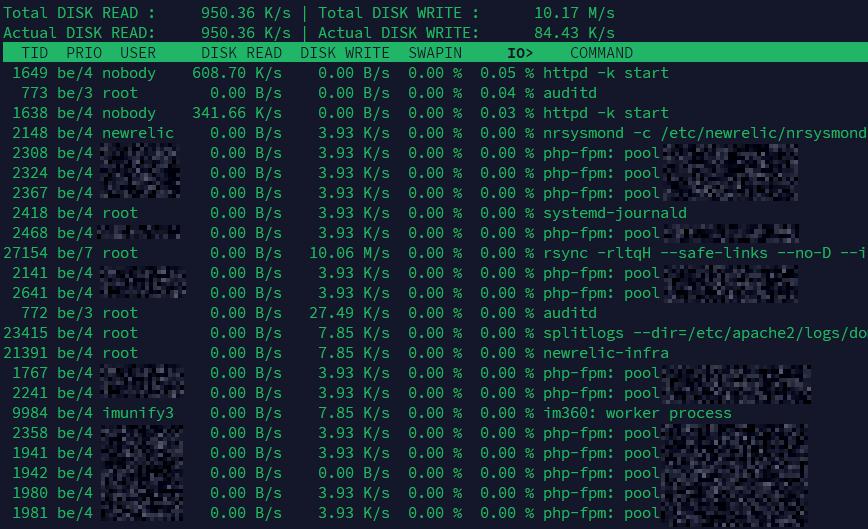
Example: iotop reveals disk read activity from Apache (httpd) and moderate writes from various php-fpm workers and background services like rsync, systemd-journald, and New Relic. Even with moderate I/O wait, this level of process-level activity can introduce latency in web applications.
When disk I/O is suspected to be the issue (which is very often the case in “idle but slow” servers), iotop is the go-to utility. It functions like a “top for I/O”, listing processes and the I/O bandwidth they are using. This helps answer the question, “Which process is hammering the disk?” or “Is any process stuck doing I/O right now?” You’ll typically run iotop with root privileges.
Here are practical iotop examples:
Interactive I/O monitoring (active processes only):
sudo iotop -o
The -o option filters the display to only show processes actually doing I/O (those with non-zero I/O usage). This is very handy because otherwise iotop would list many processes that have done no disk I/O (zero I/O bytes), which is just noise. After running this, you’ll see a live updating list of processes that are reading/writing to disk at that moment, along with columns like DISK READ and DISK WRITE (usually shown in KB/s or MB/s). If your server is feeling slow and you suspect disk, often you’ll immediately spot a process here with a large number under write or read. For example, you might catch a backup process writing at 50 MB/s, or a database doing a lot of reads. Those processes are likely why the system is waiting on I/O. The display also shows the percentage of time each process spends in I/O (IO%), which corresponds to how much of the time the process is waiting on disk – high values mean the process is often blocked on I/O (which aligns with high iowait).
Accumulated I/O over time:
sudo iotop -a
By default, iotop shows the instantaneous I/O rates. If the workload fluctuates, a process might intermittently do I/O and not show a large value at every refresh. The -a (accumulated) flag tells iotop to display the total I/O each process has done since iotop started. This gives a running total of bytes read/written. Using -a is useful if you let iotop run for a while during a slow period – at the end, you can see which process accumulated the most I/O, even if its activity was bursty. For instance, over a 5 minute window, you might see that a certain process wrote 10 GB in total, far more than others, identifying it as the major disk user. You can combine -a with -o to only accumulate stats for processes that had I/O activity (ignoring idle ones), which keeps the list focused.
Batch mode for logging or quick checks:
sudo iotop -b -n 3 -d 5 > io_log.txt
This runs iotop in batch mode (-b) for 3 iterations (-n 3), with a delay of 5 seconds between each sample (-d 5), and redirects output to a file. In batch mode, iotop will output text updates (as opposed to the interactive display). This is useful if you want to record a snapshot of I/O usage for analysis or if you are running this on a server where you can’t keep an interactive session open. After 3 intervals, it will stop. In the saved io_log.txt, you can see which processes were doing I/O in each 5-second window and how much. This approach is helpful if the slow periods are intermittent – you could schedule a cron job to capture iotop output periodically. For quick troubleshooting, even running something like iotop -b -n 3 without redirect will print three samples to your terminal and exit, which might be easier to read than the continuously updating interface.
Using iotop, you can often directly pinpoint the source of disk load. If nothing shows up in iotop (no significant disk usage), then disk I/O might not be the issue after all – which pushes you to investigate other areas (maybe network or an application stall). On the other hand, if iotop clearly shows one process with heavy I/O, you’ve found why the server is slow (looks idle because CPU waits for that I/O to complete). You can then focus on that process (maybe it’s doing too much logging, or a backup, or a misbehaving app) or consider upgrades (faster disk, more RAM to cache, etc.).
Conclusion
To troubleshoot an “idle but slow” server, use a combination of the above tools. For example, you might start with vmstat or dstat to see if the issue is I/O wait or memory. Suppose vmstat shows high wa (wait) and many blocked processes; that’s a strong sign of I/O bottleneck. Then you run iotop -o to see what’s causing the I/O and find a process doing large writes. Alternatively, if vmstat showed significant swapping (so > 0), you’d know memory is an issue; you could confirm which process uses a lot of memory via pidstat -r or with top/htop.
Always interpret the data in context: on a web hosting server, heavy I/O might be due to a backup script or an antivirus scan; on a database server, it could be slow queries causing lots of disk reads or writes to transaction logs; in a cloud VM, high steal time might hint at noisy neighbors on the host. By systematically checking CPU, disk, memory, and network, you will uncover the real bottleneck.
In summary, an idle-looking CPU doesn’t guarantee a snappy server. Slowness can come from waiting on disks, struggling with memory, or other resource stalls. Tools like vmstat, pidstat, dstat, and iotop give you the insight to identify those hidden problems. Once you find the cause, you can take targeted action: optimizing queries, upgrading hardware (e.g. moving to SSD storage), adding RAM, or adjusting workload distribution to ensure your server not only looks idle, but also feels fast!
Very, very good article!
I’m afraid that without doing look-ups, I get stuck at the first screenshot. What is
%waiexactly? Is it the overall amount of time the CPU is awaiting I/O, or is it related in some way to the%idlefigure? Either way, I/O is relatively slow, so is 8% really a lot? I don’t see how these figures indicate sluggishness.Just about. wrote an explanation of io wait here:
I agree with your primary assertion that CPU and memory are rarely the limiting factor for server performance. This is arguably true most of the time for desktop and laptop client configurations too.
What’s really illuminating are your explanations and visual examples of tools that can be used to locate the specific performance problems.
This is a really good article; took me long enough to get a good look at it!