CDN Benchmarking: How to Compare the Performance of Different CDNs
Content delivery networks (CDNs) are crucial in ensuring fast and reliable access to digital content across the globe. With numerous CDNs on the market, the ability to compare their performance effectively is essential to making the best choice for your needs.
In this guide we’ll delve into the key aspects of CDN benchmarking, explaining the metrics and methods you need to consider to make meaningful comparisons between CDN providers and plans.
Key CDN Benchmarks

Updated: Dec 2025 Median HTTP request query time from cdnperf.com
CDNs usually come equipped with features such as Anycast routing, SSL/TLS optimization, and DDoS protection. These features cater to diverse needs across industries and are intended to woo customers. But when it comes to benchmarking CDNs, specific parameters stand out in determining their efficiency and reliability: throughput, latency, cache hit ratio, and uptime guarantees. These are most often reported as average values.
Latency: Network Response Time
Latency measures the time taken for data to travel from the server to the user. This is not a constant value; it varies based on several factors, including server location, user location, and overall network conditions. CDN providers will state their latency in milliseconds, with low latency translating to faster content delivery to your audience. In general, a latency of 30ms is considered to be as good as anyone needs for a DSL connection, a latency of less than 100ms is considered excellent for CDNs to provide robust connections for live streaming or video conferencing, while a latency of up to 200ms is acceptable for most applications. These values can vary depending on the specific context and the type of content being delivered. Real-time applications, such as video streaming or online gaming, typically require lower latency due to their sensitivity to delays.
Throughput: Data Transfer Speed
Throughput directly influences the quality of a user’s streaming experience. It represents the amount of data transferred between the user and the content server over a given period in megabits per second (Mbps.) Throughput impacts all types of content but is especially impactful on large data chunks, like high-resolution video streaming and large file transfers. Good data transfer rates are subjective, but 10 Mbps is generally considered to be good for video streaming and file downloads.
Cache Hit Ratio: Content Delivery Efficiency
The cache hit ratio is the percentage of content requests that can be fulfilled from the CDN’s cache, bypassing the origin server. A higher cache hit ratio indicates a more efficient CDN, leading to reduced latency and improved overall performance. Anything below 80% is considered an inefficient caching policy.
Uptime Guarantees: Content Delivery Reliability
Uptime guarantees refer to the percentage of time a CDN is available to deliver content. A high uptime guarantee is crucial to minimizing disruptions and thereby ensuring that users have continuous access to their desired content, maintaining customer satisfaction. Uptime heavily impacts user experience and content availability. It depends on the CDN’s network, equipment, and redundancy. Your threshold should start at 99.5%.
Understanding Percentiles in CDN Performance
Assessing the above CDN metrics’ average values across different traffic scenarios is essential for ensuring a consistent user experience. However, average value metrics capture only a single point in time. To get a more comprehensive and nuanced view of CDN performance, it’s also essential to look at percentiles for each of the above benchmarks (except uptime, since that number is represented as a guaranteed minimum rather than an average.)
Let’s compare what average measurements and percentiles can tell us about CDN performance:
- Average values provide a general overview of CDN performance, but they fail to capture variations that occur under specific traffic conditions, such as regional variations, daily load swings, and content-related specifics (for example, some CDNs excel in large file delivery and video streaming.)
- Percentiles reveal how often different performance levels are achieved, thereby giving more nuanced insights into the performance you personally can expect, based on your CDN use case.
How Percentiles Work
Imagine a CDN that collects latency metrics from 1000 customers. Depending on their location, ISP conditions, routing, and other factors, at each moment their latency measurements will distribute following a bell curve, with most results falling into the average latency range (the middle of the bell curve) while lower and higher latencies are less common (the ends of the bell curve.)
When assessing CDN performance, we can ignore latencies below average (very low latency traffic.) We’re really concerned about potential bottlenecks, meaning the high latency, or slow traffic, which is on the right (high) end of the bell curve. This is where our high percentiles sit: the 4% line under “very high” on the graph below shows where the 96th percentile is, since the line sits above 96% of traffic.
 with percentiles highlighted.")
Normal distribution (bell curve) with percentiles highlighted.
In a similar vein, here’s what the most common percentile values for CDN benchmarks show:
-
- The 99th percentile reveals how the CDN handles 99% of traffic; i.e., only the most extreme 1% of traffic is excluded.
- The 95th percentile indicates how the CDN handles 95% of traffic, excluding the top 5% of traffic stress.
- The 75th percentile shows how the CDN handles 75% of traffic, excluding the most challenging 25% of traffic.
Imagine a CDN with an average latency of 30 ms—a low, and therefore desirable, value. If the 75th percentile value is 60 ms, 25% of users will experience at least twice the average latency. If the 95th percentile is 120 ms, 5% of traffic will be subject to that figure, which can cause noticeable slowdowns for your customers.
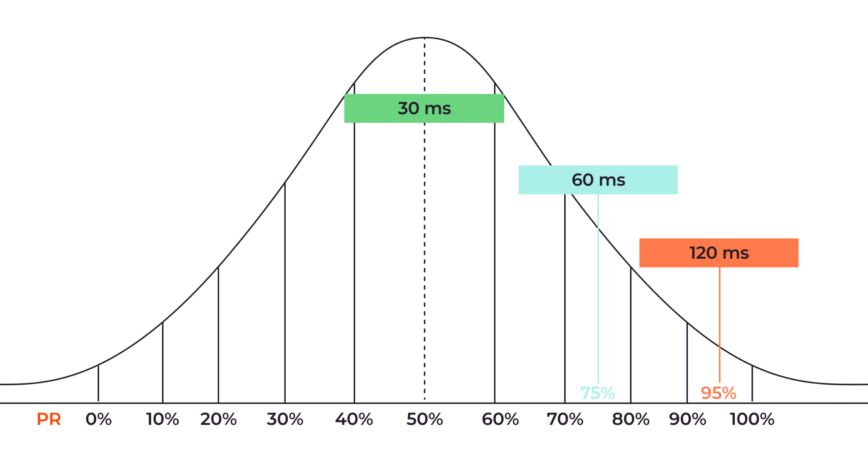
Another CDN provider might offer the same average latency but lower percentile values, which would make them the better choice.
A Note About Averages
The 50th percentile, also known as the median, separates the lower 50% from the upper 50%. This is the average traffic that a network can handle in normal conditions. If the 50th percentile is too high, it could indicate that the network is not able to handle its current traffic load and that there may be congestion on a regular basis.
Note: the average values mentioned earlier are the mean values, which is a different way of calculating the average and may produce different results to the 50th percentile. The mean is skewed by extremes compared to the median.
Choosing the Right Percentile
Now, let’s take a closer look at when you might want to consider the three most common percentile values.
- The 75th percentile can help identify consistent bottlenecks or congestions during peak traffic. The 75th percentile represents a more common scenario for a larger portion of users when compared to the 95th and 99th percentiles. It can help to identify consistent issues rather than extreme cases or outliers.
- The 95th percentile is a useful metric of unusually high, but not extreme, traffic. The top 5% of traffic could be written off as being caused by unusual events, and the 95th percentile accounts for everything else. This makes it a useful metric for businesses that rely on a stable online presence and/or businesses that don’t anticipate extreme traffic spikes.
- The 99th percentile shows extreme traffic cases or worst-case scenarios. It’s most important for businesses that can’t afford decreased performance under any circumstances, such as the financial services industry or a government emergency notification system. It could also show extreme situations like Black Friday sales for an e-commerce company, making it a worthwhile metric for businesses that anticipate even occasional extreme traffic. It might be less relevant to those who don’t expect extreme network conditions and/or can tolerate their impact on the rare occasions they occur.
An acceptable range for these percentiles varies by benchmark, individual business need, and industry, but lower values always signify better performance, indicating swift content delivery even during high traffic.
Percentile Data Analysis
When you collect and combine these percentiles into a single graph, it will look something like this:

A graph like this shows us that:
- The average latency (green) oscillates around 100–110ms in general. A drop in latency at 10:00 can be caused by the general drop in users.
- The 75th percentile (blue) indicates that 25% of users experienced peak latency of around 145 ms around 04:00. This could be due to a number of factors, such as increased network traffic or a bottleneck in the CDN’s infrastructure, so ideally, these kinds of peaks will require further investigation.
- The 95th percentile (purple) demonstrates two additional peaks for 5% of traffic at 14:00 and 22:00. Notice that these two peaks are not experienced by the 75th percentile, meaning that a smaller proportion of users encountered them.
- The 99th percentile (red) highlights an additional issue around 19:00. The 99th percentile shows latency spikes of up to 160ms at three timestamps. This could be caused by a sudden surge in traffic or a problem with a specific server, but affects only 1% of users.
The acceptable range of values for each percentile depends on factors including the type of content being delivered, the target audience, and the overall performance expectations. For instance, latency is typically more critical for real-time applications, such as video streaming or online gaming, where even small delays can significantly impact the user experience.
Keep in mind that a high difference between average latency and percentiles can indicate inconsistencies in overall CDN performance, misconfigurations, or lack of regional presence.
Independent testing tools and methods
To benchmark CDN performance accurately, using the right tools is crucial. Most CDNs have their own analysis tool called Looking Glass. Looking Glass allows you to run a set of commands such as BGP, ping, and trace directly on our different routers to assess a network’s connectivity.
However, when choosing a CDN, you might need more complex data. Tools like WebPageTest, Pingdom, and GTmetrix offer insights into CDN performance from different geographical locations. Conducting tests at different times and under diverse conditions provides a comprehensive view of the CDN’s performance. Here is an example of a GTmetrix test:

Why Gcore Excels in CDN Performance
At Gcore, we understand the intricacies of CDN performance. Our CDN is backed by a network of over 150 points of presence, with over 120 directly connected IXPs and 11,000 ISPs across six continents, ensuring that your content is delivered quickly and reliably to users worldwide.
Conclusion
CDN benchmarking is an essential process for selecting the right CDN provider for your specific needs. By carefully evaluating the performance metrics, understanding the nuances of average metrics and percentiles, and utilizing independent testing tools, you can make informed decisions that will optimize your content delivery and enhance your users’ experiences.
Written by: Sebastian Spies — Product Director, Edge Network at Gcore.

Updated this guest blog post with more recent median HTTP request query time data from Dec. 2025.
Source: