Server Density: Ops are not machines. Introducing HumanOps
Guest post by Server Density.
Sysadmins are not superhumans. They grow tired and get stressed just like everybody else.
We all know that sustained stress is detrimental to health. We also know that fatigue impairs our ability for basic problem-solving. So the question is: how do you prevent stress and fatigue from impairing the ability of sysadmins to do their best work. Over the years, and as more engineers joined the Server Density team, we’ve been fine-tuning how we resolve production incidents, how we handle on-call schedules, and how we work together remotely. All those efforts are focused at humans and systems in equal measure.
At Server Density we’ve observed a strong correlation between human and system metrics. Reduced stress leads to fewer errors and escalations. Fewer incidents and alerts lead to better sleep and reduced stress. Better sleep leads to better time-to-resolution metrics. How many interruptions and wake-ups do our engineers experience per month? How many late shifts and weekend calls? What systems do we have in place to track this information?
With this data at hand, we can start looking at making things better for humans. How do we minimize interruptions? How do we make sure our engineers get all the downtime and renewal they need? How do we alleviate stress and fatigue? How do we build systems and tools that are intuitive, and inline with how the human brain works?
Introducing HumanOps
HumanOps is a collection of principles that address those questions. It advances our focus away from systems, and towards humans. HumanOps starts from a basic conviction, namely that technology affects the wellbeing of humans just as humans affect the reliable operation of technology.
As software makers, we have significant opportunity here.
How do you spot issues before they cause downtime? How do you reduce incidents and mitigate stress? How do you present this data in a more intuitive way?
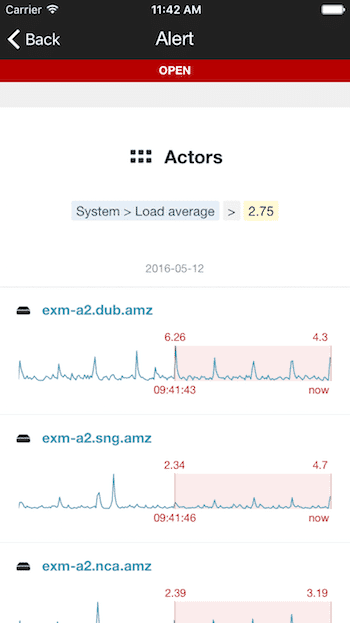
We recently launched a HumanOps feature for the iPhone, called sparklines. Sparklines condense our Server Density charts into smaller inline expressions that illustrate trends. Sparklines are a perfect match for the iPhone because they offer visual cues about “what’s happening?” allowing sysadmins to quickly decide whether to go home, or whether they can finish dinner before reaching for their laptop.
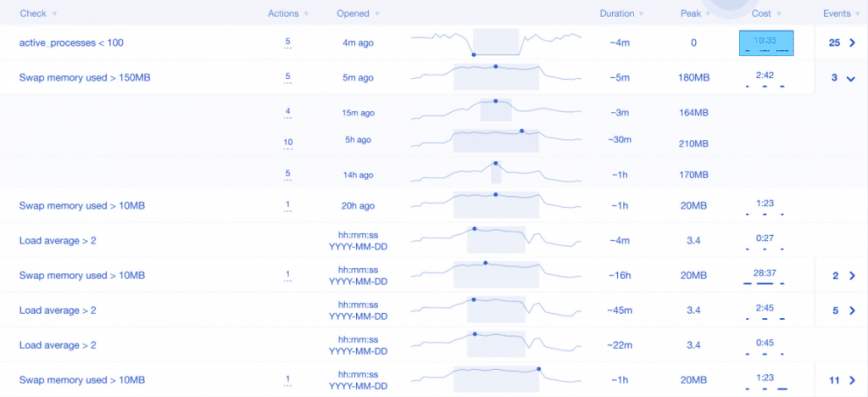
Here is a wireframe for an upcoming Server Density feature called alert history. Notice the Cost column? It measures the cost of incidents in actual human hours. HumanOps features like these (we have many more in the pipeline) are designed to create bridges between systems and humans. They also present information in a way that is easy for humans to pickup at a glance.
Humans on call
Another key part of HumanOps is on-call work. The anxiety associated with being available out of hours stems from the perceived lack of control. It doesn’t matter if the phone vibrates or not. Being on-call and not being called is, in fact, more stressful than a “busy” shift.” It is this non-stop vigilance, having to keep checking for possible “threats” that is unhealthy.
How do you restore the feeling of control? How do you measure and track the human cost of out-of-hours incidents and escalations? All those considerations fall squarely under the HumanOps agenda.
About Server Density
Server Density helps DevOps teams monitor their infrastructure, reduce downtime and improve performance, all from a from a single console, Android, iPhone, and Apple TV app. We process over 35TB/month of monitoring data from organisations such as Drupal, Greenpeace, and the NHS Ambulance Emergency Response, and thousands more. Prompt alerts let sysadmins know when something is wrong, while state of the art dashboards help them spot and troubleshoot issues before they become incidents. We offer server monitoring and website monitoring alike.
Server Density is available on multiple flavours of Linux and Windows servers. Our web interface is built using the same APIs available to everyone else. That means you get unbridled access to all of your Server Density time-series data to use however you like. Start monitoring your entire stack in minutes with 50+ integrations, or build your own custom ones using plugins and webhooks.