Best Linux GPU Monitor
Monitoring GPU performance is essential whether you’re training machine learning models, gaming or crunching data. Reliable, terminal-based tools help you visualize resource usage in real time, making it easier to spot potential issues before they become problems. Let’s look at some of the most useful utilities for tracking your GPU’s activity on Linux.
NVITOP

NVITOP is another interactive tool for NVIDIA GPUs with detailed process management and an API to integrate into custom monitoring solutions. NVITOP gives you an interactive view of NVIDIA GPUs and process management and an extensible API. So it’s great for developers and system administrators who want to put GPU monitoring data into custom solutions or dashboards. Real-time data is especially useful in high-performance computing, where fine-grained monitoring is critical.
Install via pip or using your distros package manage.
pip install nvitop
More information: github.com/XuehaiPan/nvitop.
GPUStat

GPUStat is for users who want a lightweight, simple way to keep an eye on their NVIDIA GPUs. The ncurses based interface gives you a quick snapshot of GPU usage, so it’s perfect for quick checks and troubleshooting without eating system resources. GPUStat only supports NVIDIA devices.
Install GPUStat from PyPI (with root privileges):
pip install gpustat
Or, install in your user namespace if you don’t have root privileges
pip install --user gpustat
More information: GPUstat GitHub page.
NVIDIA-SMI
[root@vgpu09:~] nvidia-smi
Sun February 2 11:20:24 2025
+-----------------------------------------------------------------------------+
| NVIDIA-SMI 470.63    Driver Version: 470.63    CUDA Version: N/A            |
|-------------------------------+----------------------+----------------------+
| GPU  Name        Persistence-M| Bus-Id        Disp.A | Volatile Uncorr. ECC |
| Fan  Temp  Perf  Pwr:Usage/Cap|         Memory-Usage | GPU-Util  Compute M. |
|                               |                      |               MIG M. |
|===============================+======================+======================|
|   0  Tesla V100-SXM2...  On   | 00000000:89:00.0 Off |                    0 |
| N/A   41C    P0    41W / 300W |  32627MiB / 32767MiB |      0%      Default |
|                               |                      |                  N/A |
+-------------------------------+----------------------+----------------------+
|   1  Tesla V100-SXM2...  On   | 00000000:b2:00.0 Off |                    0 |
| N/A   43C    P0    41W / 300W |  32627MiB / 32767MiB |      0%      Default |
|                               |                      |                  N/A |
+-------------------------------+----------------------+----------------------+
|   2  Tesla V100-SXM2...  On   | 00000000:B3:00.0 Off |                    0 |
| N/A   36C    P0    42W / 300W |  32627MiB / 32767MiB |      0%      Default |
|                               |                      |                  N/A |
+-------------------------------+----------------------+----------------------+
+-----------------------------------------------------------------------------+
NVIDIA-SMI is the official utility that comes with NVIDIA drivers and is necessary for deep, real-time monitoring of GPU performance. It gives you hardware level information on usage, temperature, power consumption and active processes, so it’s great for advanced users and administrators who want to optimize performance or put GPU monitoring into their overall system management workflows.
NVIDIA-SMI is automatically installed with NVIDIA drivers. To view GPU information, simply run:
nvidia-smi
For continuous monitoring, combine with watch:
watch -n1 "nvidia-smi"
More information: docs.nvidia.com/deploy/nvidia-smi/.
NVTOP

NVTOP (Neat Video card TOP) has a dynamic, htop like interface for GPUs. It supports multiple GPUs and shows real-time load and temperature data in a readable format. This is especially useful for users who manage systems with multiple GPUs, as it gives you clear, simultaneous monitoring of performance across complex environments.
For Ubuntu/Debian use:
sudo apt install nvtop
If that does not work, add the repository first:
sudo add-apt-repository ppa:flexiondotorg/nvtop
sudo apt update
sudo apt install nvtop
More information: github.com/Syllo/nvtop.
ROCm

For AMD GPU users, ROCm is a set of tools designed specifically for monitoring and managing GPU performance on AMD hardware. It has great documentation and active community support, so it’s a great resource for developers and administrators who want to optimize performance and troubleshoot on AMD platforms.
See their detailed install insertions for all major distros.
More information: rocm.docs.amd.com.
AI-Z
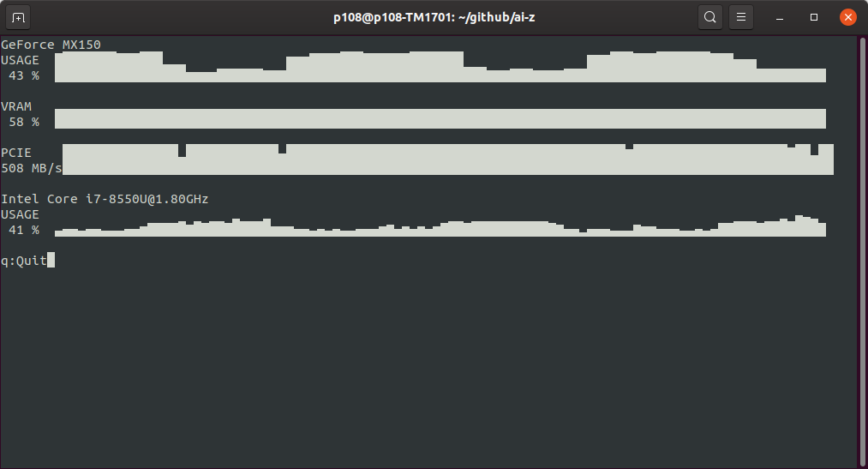
AI-Z gives you a unified view of hardware resource usage across both NVIDIA and AMD GPUs. Simple interface and cross-platform support makes it a great option for users who work with mixed GPU environments, so you can monitor your whole system without needing multiple specialized tools.
More information: ai-z.org.
Worthy mentions
The above tools are the most used and recommended for GPU monitoring, but there are a few more to consider. These alternatives have something unique to offer, depending on your use case.
nvidia_gpu_exporter

nvidia_gpu_exporter is a small tool that collects NVIDIA GPU metrics and exposes them in Prometheus format. It’s a great addition to your Prometheus and Grafana monitoring stack to monitor GPU performance along with other system metrics. It collects real-time metrics from NVIDIA GPUs and serves them via HTTP endpoint so you can track GPU performance along with other system metrics.
Clone the repository and build using Go:
git clone https://github.com/utkuozdemir/nvidia_gpu_exporter.git
cd nvidia_gpu_exporter
go build -o nvidia_gpu_exporter
Run the exporter:
./nvidia_gpu_exporter
More information: github.com/utkuozdemir/nvidia_gpu_exporter
jupyterlab-nvdashboard
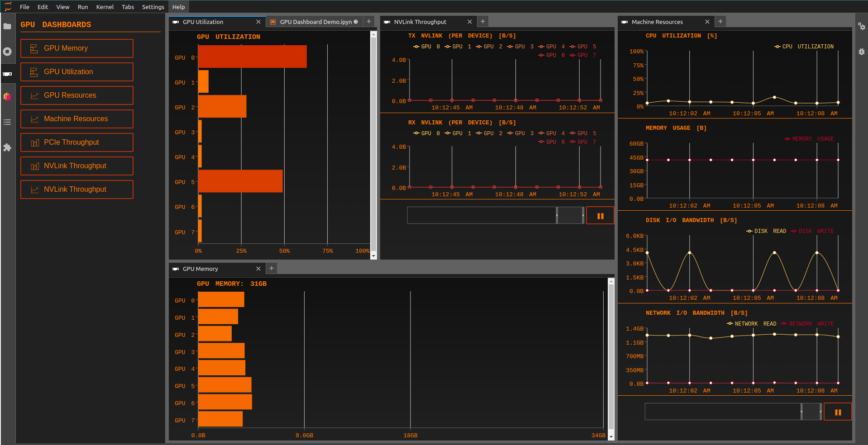
NVDashboard puts GPU usage metrics right into your JupyterLab environment, so developers and data scientists can see hardware performance without leaving their interactive workspace. This is especially useful for those training machine learning models or doing data analysis as it keeps development and monitoring close together.
Install the JupyterLab extension via pip:
pip install jupyterlab-nvdashboard
More information: github.com/rapidsai/jupyterlab-nvdashboard
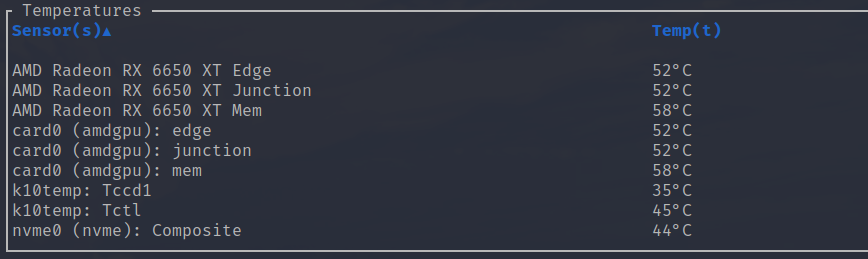
Glances

Glances is unique in that it gives you an overall view of your system, combining CPU, memory, disk, and GPU stats into one interface. It’s a cross-platform system monitoring tool and has many plugins, including the picture GPU stats support, so it’s great for users who need an all-in-one monitoring solution that can adapt to different hardware and usage scenarios.
Install Glances via pip:
pip install glances
Or via your distribution’s package manager (Ubuntu/Debian):
sudo apt install glances
More information: nicolargo.github.io/glances.
btm (bottom)
btm is a modern system monitor written in Rust, has a beautiful and highly customizable terminal interface. It may require some configuration to show GPU temperatures along with CPU, memory and disk usage, but it’s fast and pretty, so power users and system administrators love it.
On distributions where btm is available as a package:
sudo apt install btm
Or using Rust’s package manager, Cargo:
cargo install bottom
More information: linuxblog.io/btop-the-htop-alternative | github.com/aristocratos/btop.
Final Thoughts
Pick the right GPU monitoring tool for you. If you want a lightweight solution, GPUStat gives you a quick look at your NVIDIA GPU. NVTOP and NVITOP give you more interactive views with process management. For system-wide monitoring, btm (bottom) and glances provide GPU stats along with CPU, memory and disk usage. NVIDIA-SMI is the official tool for in-depth insights into NVIDIA GPU performance.
For AMD users, also check out: amdgpu_exporter and rocm-smi-lib. Sorry, I don’t have any experience with Intel. But intel_gpu_top and intel-gpu-exporter seems like the way to go.
If you have multiple GPUs, logging data for long-term analysis or integrating with monitoring stacks like Prometheus and Grafana and using them with exporters. With the right tools, you’ll have full visibility into your GPU’s workload, whether it’s training AI models, gaming or running high-performance computing tasks.
