When is it time to add more application monitoring?
Guest post by James Paden, Partner at Instrumental
At Instrumental, we often talk about getting started with monitoring. In the past, we’ve covered the critical, but basic, metrics everyone needs on our Ultimate Monitoring Metrics Cheatsheet (many of which are gathered by out-the-box system and service monitoring). We also wrote the Quick-Start Guide to Monitoring Your Application, which discussed initially monitoring:
- Your test suite
- Your features
- The inverse of your code coverage
But once your monitoring is setup, how do you know when it’s time to expand the number of, or types of things you monitor?
Having comprehensive monitoring for every line of code and every application interface sounds awesome, but implementing that is tedious (Pareto principle at work). Not to mention, that much monitor typically leads to information overload, and can waste significant time when searching for solutions to problems.
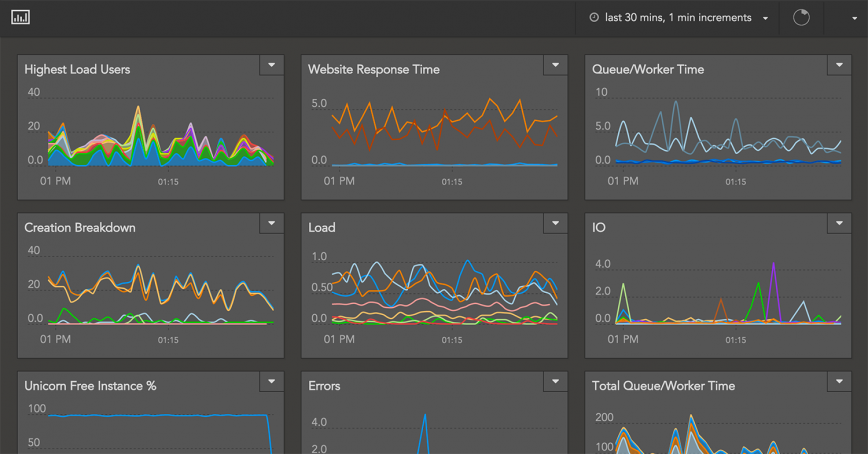
So how do you decide when to implement more monitoring? Two simple rules provide all the guidance you need:
If you have a question, and it takes longer than a minute or two to answer, you should instrument the relevant code. Grepping through production server logs is not the answer, especially in the middle of a crisis. Monitoring is the fastest and easiest way to learn about the state of your production software.
If you need to see the outcome of a change in your application, make sure all the relevant code is being monitored. You should also annotate the change for easy visibility! When features are shipped or infrastructure is upgraded, use monitoring to ensure the changes have the desired outcome.
One of the reasons application monitoring is so effective, is because you can measure business outcomes and technical outcomes in the same platform.
It most often comes down to those two things. If you ever need the answer to a question, monitor it. If you’re changing your application, monitor the change. Pretty soon, you’ll have enough important code instrumented that you’ll find answers to questions about the state of your application in seconds.
We think these hyper-focused metrics are the best way to ensure that your application is performing at its best. While we offer great server and system monitoring , Instrumental’s focus on custom metric monitoring is what sets us apart. Let us know if you have any questions at @Instrumental