Linux server needs a RAM upgrade? Check with top, free, vmstat, sar
Sometimes, it can be a bit of a challenge knowing if and when you should upgrade the RAM (random access memory) on your Linux server. Even more so, when deciding how much memory you should add, or if you have adequate memory, how do you make the best use of it?
This article will walk you through performing command line checks on Linux servers using a few real-world examples. Also included is brief advice to help clarify your path forward if you currently face Linux server memory management choices.
Look at the first screenshot below; based on the output of ‘free -m’ on a 1 GB VPS and considering the amount of swap space in use (details further below), a RAM upgrade was necessary.
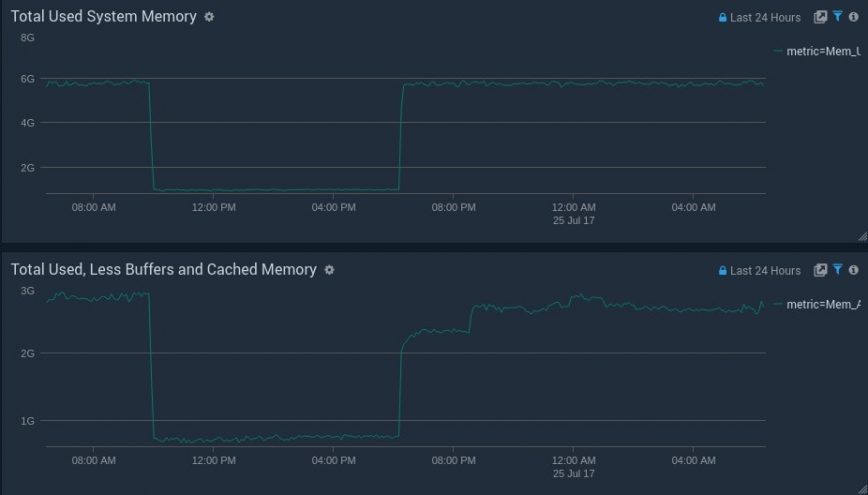
We needed at least 3 GB, so we opted for an upgrade to 6 GB. This ensures that there’s adequate memory available for buffers/cache. After the memory upgrade (around 9:30 am), here’s how load averages responded:

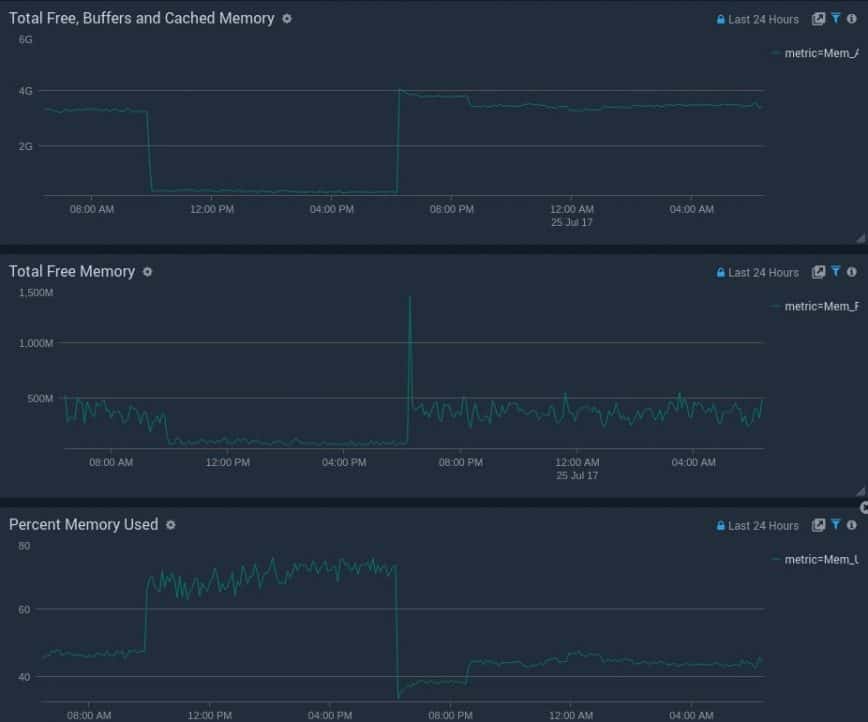
Here are three additional before and after memory graphs of used vs free memory:
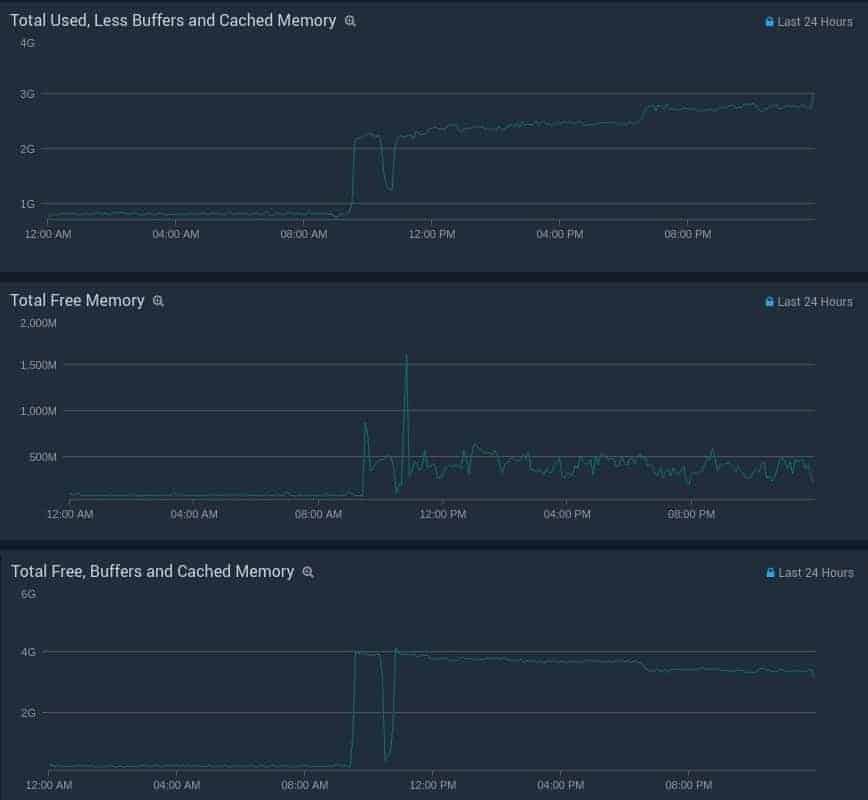
Checking if your Linux server needs a memory upgrade
Has your Linux server been acting slower than usual lately? Or maybe you’ve noticed higher CPU usage with the same traffic levels? Sometimes server performance can change overnight. This could be due to many reasons, such as increased web traffic, changes to your database size/queries, and your application or network, to name a few.
To check the current state of your Linux server’s memory usage, you’ll want to use one or more of the following command line tools: free, top, vmstat, and sar.
free command: check server memory and swap
The free command displays the total amount of free and used physical and swap memory in the system, as well as the buffers used by the kernel. It’s a more user-friendly method of reading the output of cat /proc/meminfo.
The free command, although simple, used to be one of the most misinterpreted Linux command line tools. However, as of Kernels 3.14 (and emulated on kernels 2.6.27+), the Linux free command made a few changes. Some of these helped admins realize they have a lot less free or available memory than they thought.
Many blog posts, QAs, articles, and server monitoring tools advise that your Linux server’s Free Memory = Free + Buffers + Cached = WRONG!
Using free -m (m = display the amount of memory in megabytes). The screenshot below is from the same 1 GB memory Stacklinux VPS from the screenshots above.
Here’s a breakdown of what’s being reported:

991 – total: Total installed memory (MemTotal and SwapTotal in /proc/meminfo)
628 – used: Used memory (calculated as total – free – buffers – cache)
61 – free: Unused memory (MemFree and SwapFree in /proc/meminfo)
180 – shared: shared memory used (mainly) by tmpfs (Shmem in /proc/meminfo, available on kernels 2.6.32, displayed as zero if not available)
301 – buff/cache: Memory used by kernel buffers (Buffers in /proc/meminfo) / cache: Memory used by the page cache and slabs (Cached and Slab in /proc/meminfo)
35 – available: Estimation of how much memory is available for starting new applications without swapping. Unlike the data provided by the cache or free fields, this field takes into account page cache and also that not all reclaimable memory slabs will be reclaimed due to items being in use (MemAvailable in /proc/meminfo, available on kernels 3.14, emulated on kernels 2.6.27+, otherwise the same as free).
6015 – swap: the total amount of swap memory.
1522 – swap used: the amount of swap memory that is in use.
4493 – free swap: the amount of swap memory that is not in use.
Older versions of free look something like this:
free -m
             total   used  free  shared  buffers  cached
Mem:           x      x      x       x       x      x
-/+ buffers/cache:    x    x
Swap:          x      x    x
Notice the extra buffers/cache line. To see this buffers/cache split in the latest 3.14+ Kernel versions of free, use the ‘-w’ option. For example: free -mw, -hw, -w, etc. When you type cat /proc/meminfo the first three lines are: MemTotal, MemFree and MemAvailable. That third line (MemAvailable) isn’t listed on older Linux installs.
So, how much free memory do I have?
You will always have some free memory on Linux. Even with constant swap I/O, you’ll notice some free, buffered and cached memory. The Linux Kernel will use swap space (if swap is enabled) to maximize the amount of free or available memory as much as possible. As per the screenshot above, there are over 300 MB of ‘buff/cache’ and 61 MB marked as ‘free’. But over 1.5 GB of swap. If you do not have a swap enabled on your server, you’ll notice poor performance, a low ratio of buffers/cache, system freezes, or worse.
On a server with swap space, the best indicator that memory is low will be a high frequency of swap I/O. In this case, there’s 1 GB of RAM, but 1.5 GB of swap, and kswap (kernel service that manages swapping) is using most of the CPU time.
Bonus: Check out the command: slabtop
top command: check server memory and swap usage
In the video above, I’ve used top to look at memory plus swap usage. Notice kswap and the ‘wa’ spike together. These spikes also show that the web server’s performance is being directly hampered because of kswap swapping to disk.
As mentioned, kswap is a process used by Linux to manage swap on the system, while ‘wa’ is I/O wait or time that the processor/processors are waiting during which there are outstanding I/O requests. Let’s look at this more closely using vmstat and sar. Unlike the free and top commands, the remaining tools are consistently documented online.
vmstat command – check server memory and swap usage
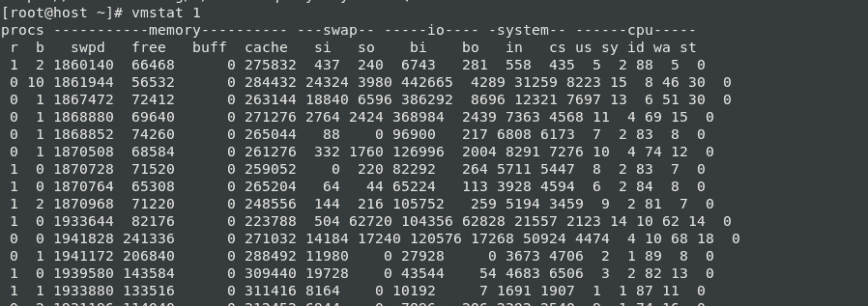
vmstat reports information about processes, memory, paging, block IO, traps, and CPU activity. Let’s use vmstat 1 as per the above screenshot. Notice the si (swap in), so (swap out) and wa (wait) columns. Swap I/O is not always bad; opportunistic swapping can help with performance. However, a high frequency of swap i/o appears on almost every line (every second). Here’s what the same command looks like on a healthy server.
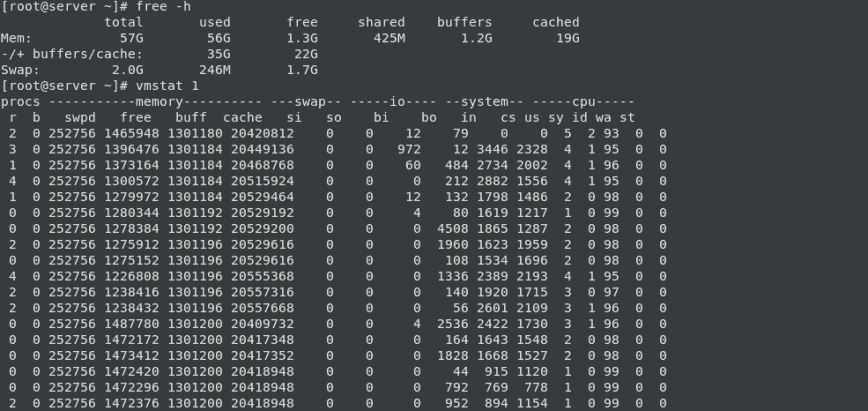
As pictured in the screenshot, you can see even with 1.3G of free RAM; the server also has 246M of used swap. This is from opportunistic swapping. Or swap performed during idle moments that do not negatively impact the server’s performance. Usually, this 246M is data that has not been used for a long time. Continue reading below for how you can increase the overall cache that the Linux server holds on to without increasing the frequency and size of swap cache.
sar command – check server memory and swap usage

With sar, you can collect, report, or save system activity information. Like vmstat, sar also can be used for a lot more than checking memory and swap. The above screenshot is also from the same 1 GB VPS we started with.
Compare these results with the sar -r results on a healthy Linux server:

Kernel cache pressure and swappiness
Another method of squeezing the most from your server memory is to tune the system’s swappiness (tendency to swap) and cache pressure (tendency to reclaim cache).
swappiness – This control is used to define how aggressively the kernel will swap memory pages. Higher values will increase aggressiveness; lower values decrease the amount of swap. (default = 60, recommended values between 1 and 60) Remove your swap for 0 value, but it is usually not recommended in most cases.
vfs_cache_pressure – Controls the tendency of the kernel to reclaim the memory, which is used for caching of directory and inode objects. (default = 100, recommend value 50 to 200) )
To edit, you can add or replace these lines in /etc/sysctl.conf file. For example, if you have low memory until you upgrade, you can try something such as:
vm.swappiness=10
vm.vfs_cache_pressure=200
This will increase the cache pressure, which may seem somewhat counterproductive since caching is good for performance. However, swapping also reduces your server’s overall performance significantly more. So not keeping as much cache in memory will help reduce swap/swapcache activity. Also, with vm.swappiness set to 10 or as low as 1, it will reduce disk swapping.
On a healthy server with lots of available memory, use the following:
vm.swappiness=10
vm.vfs_cache_pressure=50
This will decrease the cache pressure. Since caching is good for performance, we want to keep cache in memory longer. Since the cache will grow larger, we still want to reduce swapping so that it does not cause increased swap I/O.
To check current values using these commands use:
sudo cat /proc/sys/vm/swappiness
sudo cat /proc/sys/vm/vfs_cache_pressure
To enable these settings temporarily without rebooting, use the following commands:
sudo sysctl -w vm.swappiness=10
sudo sysctl -w vm.vfs_cache_pressure=50
Here’s cat /proc/meminfo output of both servers side by side:
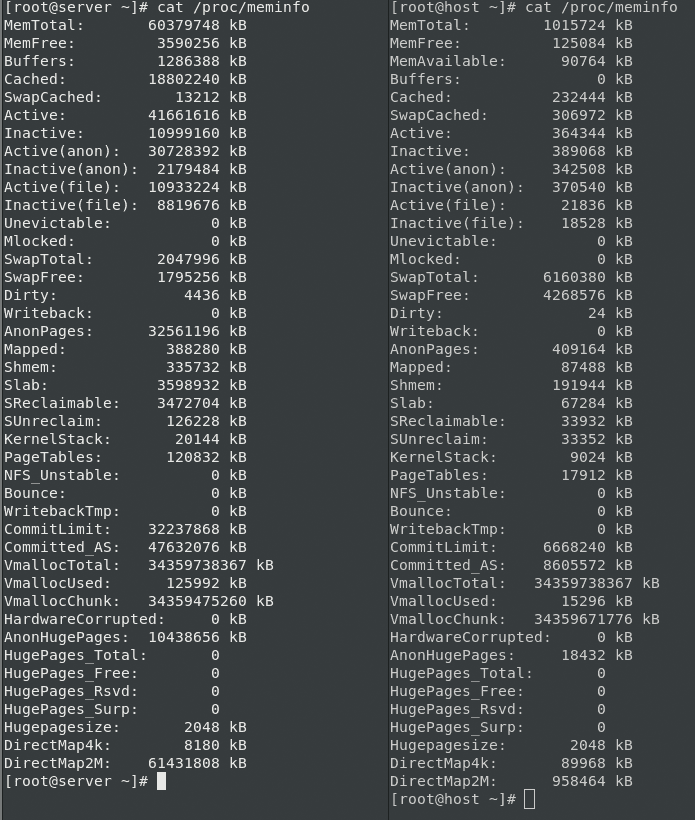
Notice the healthy server on the left; the ‘SwapCached’ is low even with a low vm.vfs_cache_pressure setting of 50.
Update: Here are some screenshots of the server @ 6GB RAM, then 1GB, and then finally back to 6GB:

And finally, the outputs of post-upgrade free and top:


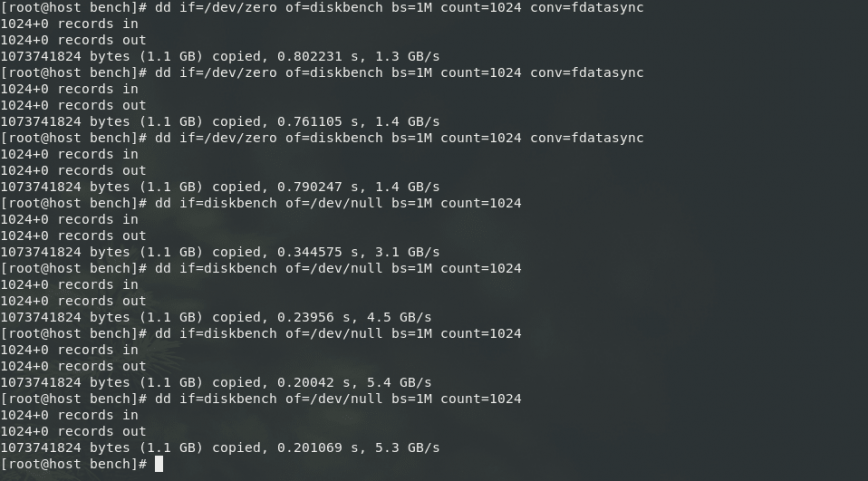
Kernel buffer on VMs – Notice on the VPS the kernel buffer is zero. This usually should not be the case. VirtIO is being used as the storage BUS driver/interface, and a lot of the disk cache handling is handed off to the KVM hypervisor. The buffers are for disk operations. So we’ll see that number increase when the disk write cache needs to be written out. You can see the I/O on a StackLinux VPS is quite fast (Also see: Your Web Host Doesn’t Want You To Read This: Benchmark Your VPS)
Conclusion
Managing RAM on your Linux server is crucial for optimal performance. This article has provided insights into determining whether a RAM upgrade is necessary and how to make the best use of your server’s memory.
Using command line tools like ‘free,’ ‘top,’ ‘vmstat,’ and ‘sar,’ you can assess your server’s memory usage and identify potential issues. It’s important to consider factors such as swap space, which can affect server performance significantly.
Additionally, the article discussed the importance of tuning swappiness and cache pressure to maximize memory efficiency. These adjustments can help strike a balance between caching for performance and avoiding excessive swapping.
In summary, monitoring, and managing your Linux server’s memory is essential for ensuring smooth operation and optimal performance, and the tools and tips provided here can help you make informed decisions about RAM upgrades and memory optimization.
Published: Jul 25, 2017 | Last update: January, 11th, 2025.
How about this server? Do you guys think it needs a RAM upgrade? It’s starting to swap:
Does not seem that way, it’s showing a massive amount of cached/available memory, which is healthy. Load avg also seems fine.
Sharing the output of
free -mshould confirm this.You should change the vm.swappiness value to a lower one. This will reduce how aggressive linux is with ram swapping. It’s easy enough to find out how.
You can refer to this post on the ubuntu forums as it includes applying permanent changes.
Also the numbers do not quite line up on memory. 7/58GiB of memory used… but the bar is full?
@hydn Here’s the output of the free command:

Thanks. So as suspected, everything looks healthy. You have over 50G of available memory. As per the article:
> available = Estimation of how much memory is available for starting new applications, without swapping.
This means that the 330M of swap used is extremely likely to be opportunistic swapping which is also healthy. Also, from the article:
> “This is from opportunistic swapping. Or swap performed during idle moments that do not negatively impact the server’s performance.”
Personally, I wouldn’t reduce vw.swappiness. You should tweak this only if you notice frequent swapping that affects performance. By reducing, it’s likely the 330M of memory freed up would instead still be sitting in buff/cache. It’s an insignificant amount now, but everything is flowing in the right way.
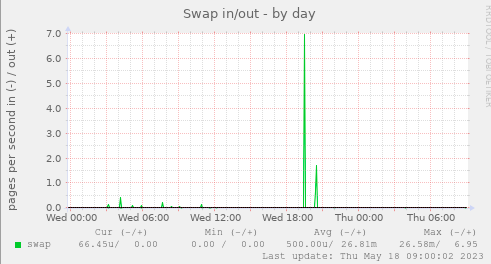
I’d say just let things run. Set up server monitoring so you can see when swapping occurs and be sure it’s always during idle server time.
Example:
Opportunistic swapping ref: Linux Performance: Almost Always Add Swap Space - #17 by xenyz
Hope this helps.