Using New Relic to Monitor Nginx. Here’s how.
New Relic has great tools to monitor NGINX, giving you visibility into server performance, request handling, and traffic patterns.
Previously, we used Plugin Central to monitor NGINX, now New Relic integrates directly with NGINX through its Infrastructure Agent and APM tools. This guide will show you how to set up and optimize your monitoring with the new features.
Why Monitor NGINX with New Relic?
Monitoring your NGINX server means you can run your servers efficiently by tracking what’s happening on the server and detecting bottlenecks before they impact performance. Key metrics are client connections, request rates, response times, and error rates.
These will give you insight into server utilization, traffic trends, and allow you to resolve issues like configuration errors or resource limitations quickly.

Setting up NGINX Monitoring
To monitor NGINX, install the New Relic Infrastructure Agent, which collects system data and is the foundation for the integration. Follow the official installation guide for your OS. If you’re new to Linux, take a look at these 90 Linux Commands Frequently Used by Linux Sysadmins to help with basic setup tasks.
Once the agent is installed, enable the NGINX integration by configuring the ngx_http_stub_status_module and create an integration file to define the STATUS_URL. You can find the configuration steps in New Relic’s NGINX integration documentation.
Restart your NGINX server to apply the changes. Go to the Infrastructure tab in your New Relic dashboard, and you should see data coming in from your NGINX instance. This will give you a base to monitor performance metrics and identify issues.
What to Monitor?
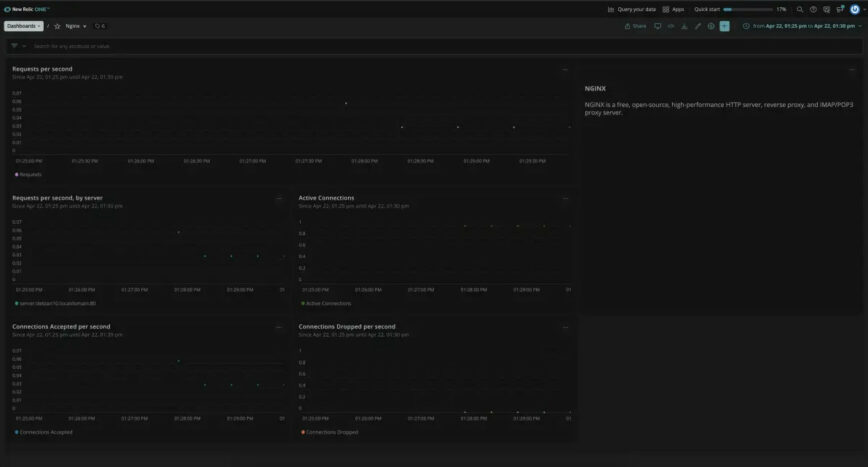
Monitoring performance starts with understanding your server’s health and activity. Metrics like active client connections and requests per second will give you a snapshot of server load. Error rates and dropped connections will show you problem areas.
Other useful metrics are the rate of reading requests and writing responses, which will show you NGINX’s processing efficiency. These will help you identify bottlenecks, optimize resource allocation, and maintain performance.
Advanced Monitoring with New Relic APM
For applications behind NGINX, New Relic APM has features like transaction tracing, error monitoring, and performance analysis. By correlating server-level metrics with application data, you get a complete view of your environment. This level of integration means you can address issues at the application and server level efficiently. For more tips on managing server connections, read our guide on killing inactive SSH sessions.
Viewing Data in the New Relic Dashboard
Once configured, the New Relic dashboard is your performance monitoring hub. Use the Infrastructure tab to view NGINX metrics and customize your view with filters and time ranges to focus on specific data.
The built-in query builder will let you create custom visualizations and reports to drill deeper into server behavior. This will allow you to see trends, identify anomalies, and make data-driven decisions.
Best Practices for Monitoring Nginx
To get the most out of your monitoring setup, make sure your configuration files are reviewed and updated regularly. Watch key metrics like connection rates and response times, and set up alerts for high error rates or dropped connections.
Periodically update your NGINX configuration based on New Relic data to improve performance. For troubleshooting, check New Relic’s diagnostic tools and community resources to help you resolve any issues.
Conclusion
NGINX and New Relic give you end-to-end visibility to manage server performance, traffic, and application behavior. With modern monitoring tools and server metrics, you will always be optimized. Go to New Relic’s NGINX integration documentation to get started.
Published: Oct 27th, 2013 | Updated: Dec 16th, 2024