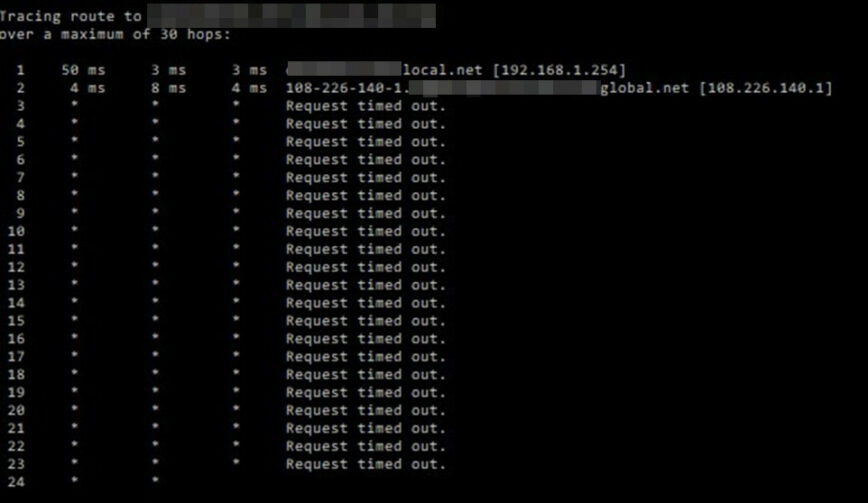
traceroute command in Linux with examples
This traceroute command guide follows my previous 90 Linux Commands frequently used by Linux Sysadmins article. As time allows, I will continue to publish articles on the 90+ commands geared toward Linux sysadmins and Linux power users. Let’s continue this series with the traceroute command.
When it comes to troubleshooting network connectivity and understanding the journey of your data packets through the vast expanse of the internet, the “traceroute” command is a powerful tool at your disposal. In this article, we’ll delve into the world of the “traceroute” command in Linux, exploring its capabilities and providing you with practical examples of how to use it effectively.
What is the traceroute Command?

The “traceroute” command, also known as “tracert” in some systems, is a network diagnostic tool used to trace the route taken by data packets from your computer to a destination host. It helps you identify the intermediate routers and measure the time it takes for packets to travel through each hop. By doing so, “traceroute” enables you to pinpoint network issues and understand the path your data traverses.
traceroute – Basic Syntax
The basic syntax of the “traceroute” command is as follows:
traceroute [options] host_or_IP_address
A few examples of using the traceroute command:
To get started with traceroute, check out these command examples.
Tracing a Route
To trace the route to a destination host, simply use the “traceroute” command followed by the host or IP address. This command will display a list of intermediate hops, showing the IP addresses and round-trip times for each:
traceroute example.com
Specifying Maximum Hops
You can limit the number of hops “traceroute” will trace by using the -m option. For instance, to limit it to 10 hops:
traceroute -m 10 example.com
Using ICMP Echo Requests
By default, “traceroute” uses UDP packets. If you want to use ICMP echo requests (similar to the “ping” command), you can do so with the -I option:
traceroute -I example.com
Displaying Hostnames
To resolve IP addresses to hostnames in the output, you can use the -n option to disable reverse DNS lookups:
traceroute -n example.com
Continuous Tracing
If you want to continuously trace the route to a host, use the -q option to specify the number of probes per hop. Here, we use it to send three probes per hop:
traceroute -q 3 example.com
Conclusion
The “traceroute” command is an invaluable asset for network administrators and anyone interested in understanding the intricacies of network routing in Linux. By using “traceroute,” you can diagnose network issues, detect bottlenecks, and gain insights into the path your data takes across the internet.
While we’ve explored some of the basic options and usage examples of “traceroute” in this article, it’s important to note that this tool offers even more advanced features for in-depth network analysis. Use man traceroute to view even more.
So, the next time you encounter network problems or simply want to satisfy your curiosity about the path your data follows, fire up your terminal and embark on a journey of discovery with the “traceroute” command. It’s your window into the fascinating world of network routing in Linux.
Useful links/references:
Related commands:
- tracepath – very similar function to traceroute.
- mtr – network diagnostic tool.
- ping – send ICMP echo_request to network hosts.