PHP Monitoring Instrumentation for Laravel Web Artisans
Over the last decade, Laravel has evolved to become an elegant open-source web application framework that’s approachable for beginners and experts alike. There are multiple solutions available to instrument your application on your local dev box, staging, and production, and there are just as many options to monitor these instrumentations. While the Open Telemetry PHP library is taking shape, PHP instrumentation for commercial tools like SolarWinds® AppOptics™ offer an easy installation experience along with auto-instrumentation of popular frameworks such as Laravel.
In addition to PHP and Laravel, AppOptics has broad language and framework support for monitoring your applications.
When considering what type of monitoring is the best for your team, it’s important to consider what you want to measure, how you want the data to be presented, and what tools will be the most helpful for troubleshooting and optimization.
What’s Next?
If you’re set up an open-source tool, at this point, you may well be dusting your hands off and considering this a job well done. However, is this the full picture of how your web application is performing? Is this adequate visibility? I’d make the observation (pun intended) that no, this is just the beginning of your monitoring journey for your application.
Your application could be hosted on-premises, on cloud services, and could be utilizing any mixture of common integrations. For these complex deployments, there will be a mixture of metrics you’ll want to monitor for full-stack observability.
Metrics
When thinking about what metrics you need to gather, let’s think about your application’s services, microservices, transactions, database queries, and anything else to help the front-end function. For those utilizing NGINX and PHP-FPM, there are some great recommendations from Hayden on max performance guidelines, and we’ve previously discussed the best NGINX Reverse Proxy metrics to monitor.
For PHP-FPM, pm.max_children will be one of many metrics you’ll want to keep an eye out on especially if you’re following the tuning guidelines for pm static. SolarWinds AppOptics monitors this along with the number of idle, active processes. In addition, if you’re noticing a non-zero number of slow requests, this has commonly been flagged because of poorly written MySQL queries. With proper instrumentation, you can detect this state by monitoring PHP-FPM directly, or from the application perspective itself. Tack on MySQL metrics monitoring combined with deep performance monitoring to achieve highly optimized performance for your application.

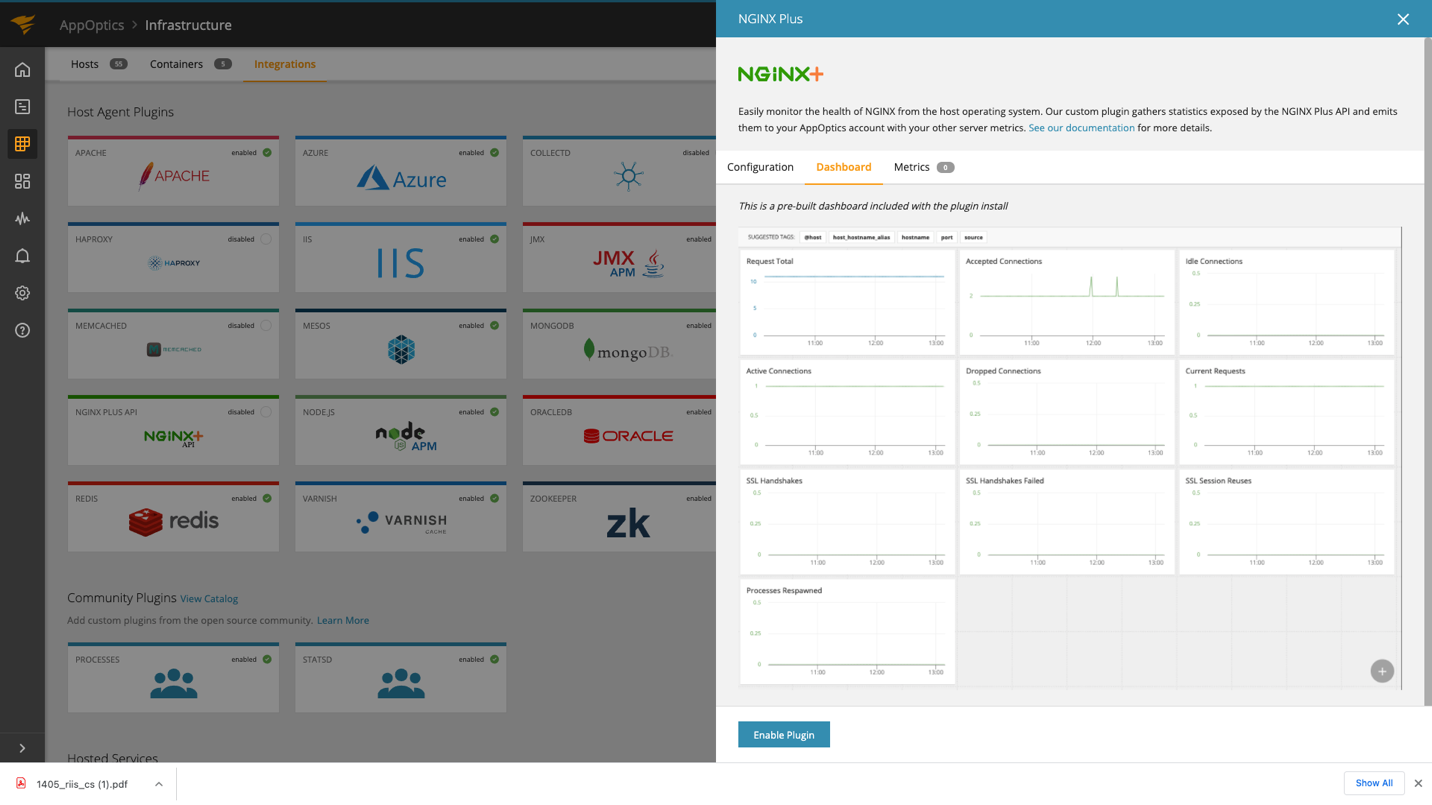
For NGINX, if you’re using the paid version (NGINX Plus) you have a wide array of metrics to monitor. SolarWinds can pull metrics from the ngx_http_api_module conveniently with our SNAP NGINX PLUS API plugin to give you access to correlate those metrics from MySQL, PHP_FPM to the location zone requests or the number of failed SSL handshakes. Monitoring the full picture is only possible when you have the right tools.
Deployment
As referenced earlier, deployment has grown steadily more complex. You could be operating your own servers in a data center, running your Kubernetes cluster in the cloud, or deploying using an app platform such as Heroku.
All these scenarios are supported with easy installation support with AppOptics installation wrapper script or simply enabling the AppOptics add-on. If your application gets even more complicated, AppOptics has 150+ plugins and integrations to start collecting metric data fast.
Tools for Troubleshooting
Stuff happens, and when it does, time is of the essence, so you need to get at the root cause fast and minimize the time it takes to get your application back to performing as designed. AppOptics was built on the best features of open-source monitoring tools while providing the support and ease of a commercial product.

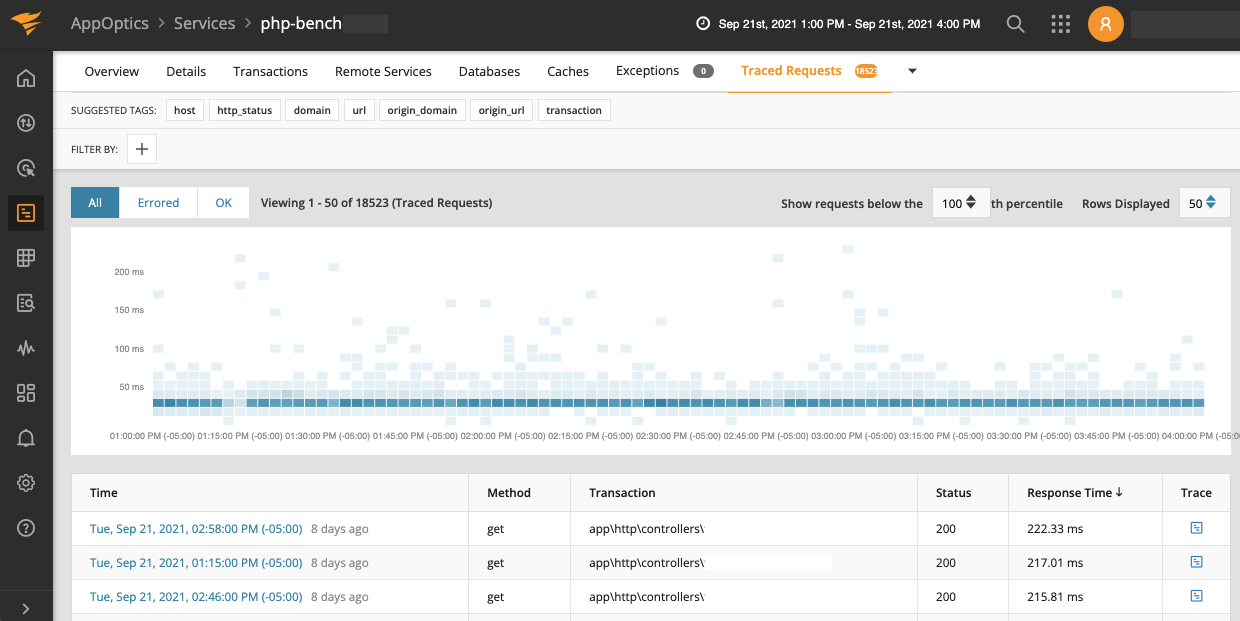
Distributed transaction tracing enables you to follow a request of your application as it traverses front-end PHP services to the back end. This data is key in understanding the performance of distributed applications because as AppOptics continuously mines the app for data, you can drill down into each trace for information.

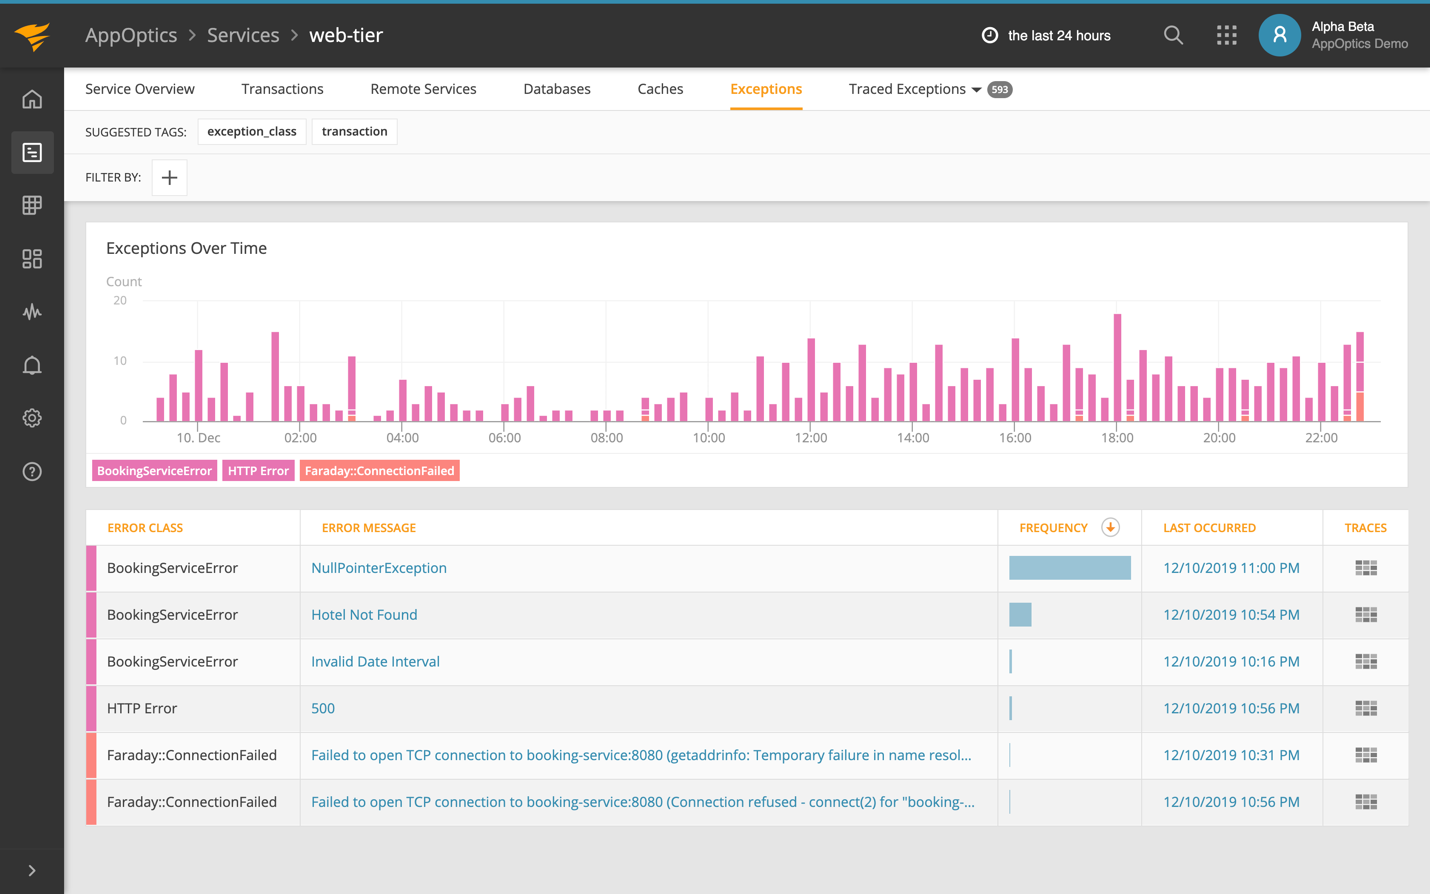
Exception tracking builds on top of the AppOptics automatic tracing capability and provides a summary of exceptions happening within a service context. When troubleshooting a service, you can understand the current volume of exceptions, when they started, and which exceptions are most frequent. You can drill into each exception, view the stack trace, and see which endpoints in the application are throwing them.

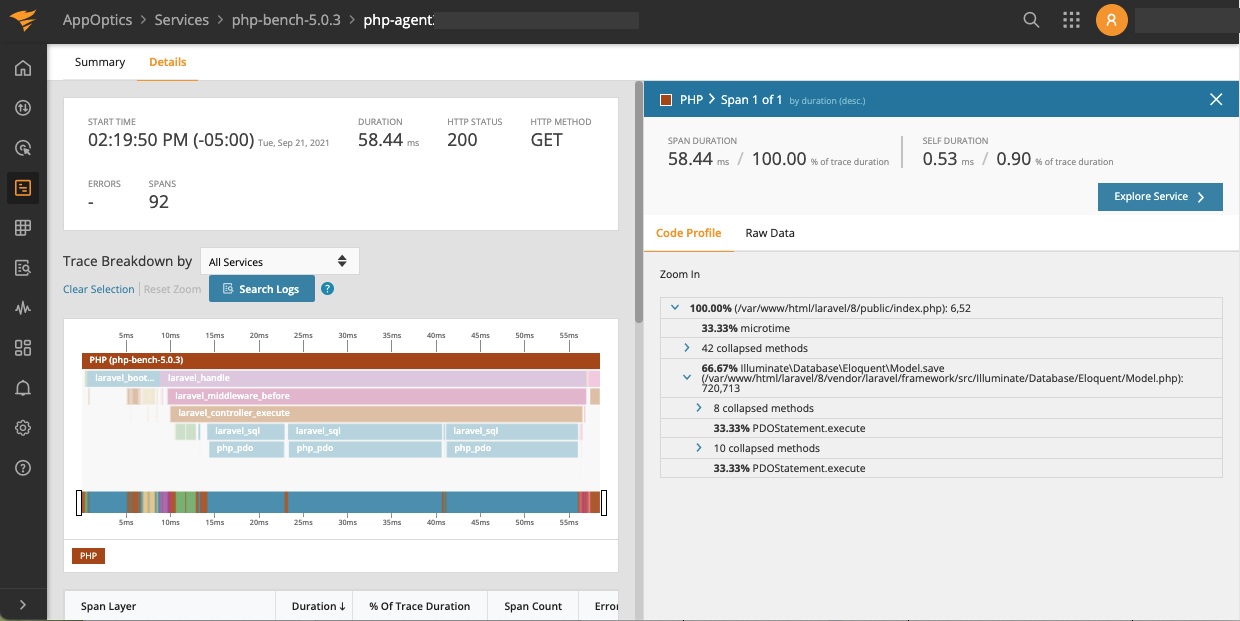
Live code profiling shows your PHP code and provides a breakdown of the most frequently called functions and methods in a transaction. Profiling is gathered in a manner tailored to each language and typically includes information down to the class, method, filename, and line number. It provides enough detail to understand what line of code is causing a performance issue and includes the information needed to find the relevant section in the source code quickly.
Conclusion
There are many open-source options to monitor PHP applications at your disposal, but time is valuable, and you’re going to need a robust set of tools to monitor code-level bottlenecks and those found in the underlying infrastructure. Make sure you’re evaluating a toolset that can give you a full picture across your metrics and trace with flexible deployment options that meet the complexities of your monitored environment.
SolarWinds AppOptics is an easy-to-implement APM solution with application monitoring (distributed tracing, code-level profiling, and exception tracking), and infrastructure monitoring (hosts, containers, serverless), proactive alerting, out-of-the box dashboards, and custom metrics to continuously monitor your application.
If you’re interested in learning more about AppOptics, use these links to learn more about AppOptics APM, read how it can help you improve PHP performance, or start a free trial.