pfSense Firewall 2.8: Install & Config – Settings Walkthrough
Let’s pick up right where Part 1 left off: pfSense Firewall Appliance Unboxing. This isn’t a quick-start guide. It’s my logbook from weeks of fine-tuning pfSense. Weeks, not years, so follow along and let’s learn and improve our pfSense configs together. In this article, I share my pfSense setup: interfaces, firewall rules, pfBlockerNG, Suricata, the works. A pfSense guide based on my journey to find the best config that works for me.
It’s my first time using pfSense, but I’ve managed various firewalls on Linux servers over the years. By sharing my config, I hope to welcome corrections, suggestions, and to help readers who are just getting started with pfSense.
The main goal here that we configure a secure pfSense firewall setup that survives ISP hiccups while providing added visibility into what’s going in and out of our home lab, home office, or small business networks. You know, peace of mind, all while being interesting!
pfSense Hardware & Prep
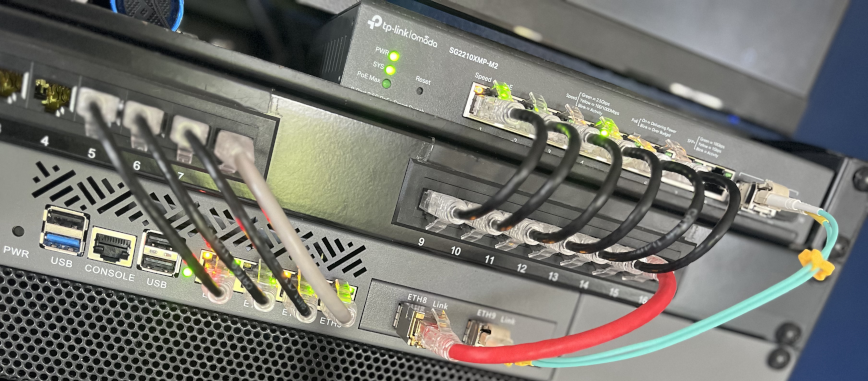
Photo of my current home lab. A work in progress.
If you haven’t settled on a firewall appliance yet, check out my unboxing write-up first (Part 1): Intel N100 CPU, 82599ES 10G SFP+ NIC, and i226-V 2.5G ports give you plenty of headroom while keeping power under 15W at idle. Note that some links below point to Amazon, where I earn a small amount on qualifying purchases, while other links direct you to manufacturer or product pages and other related resources that I’ve found useful during my pfSense firewall setup.
Choosing pfSense hardware
There are a host of hardware options available. I’ve filtered some of the best pfSense hardware options, that you can currently find on Amazon, as well as eBay.
RAM is cheap, around $15 to $20; start with at least 4 GB if you intend to run Suricata and pfBlockerNG concurrently. Then drop in a 128 GB NVMe for $20 for fast storage.
In my case, I’m using a 256 GB TEAMGROUP MP33 that I purchased back in 2022. Full parts list and thermals are in the unboxing post: My $300 pfSense Firewall Appliance – Part 1: Unboxing.
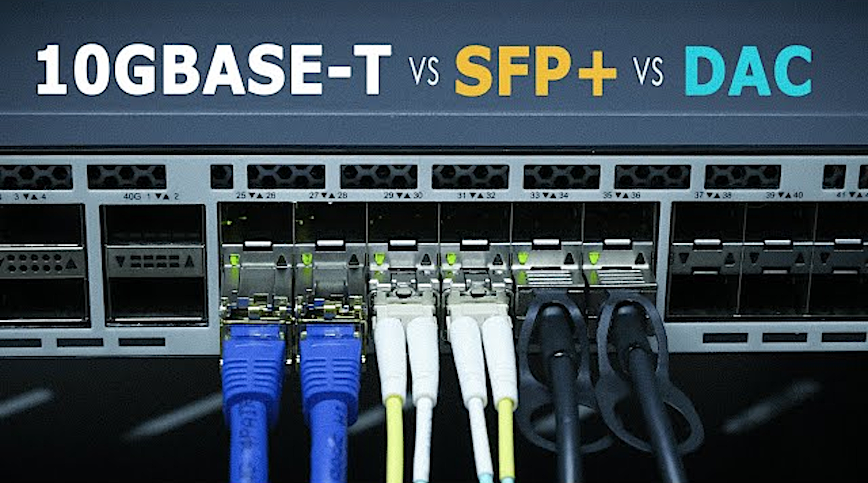
10G Uplink Options: Cat6, Fiber or DAC?
For connecting the 10G SFP+ port from my pfSense box to my TP-Link SG2210XMP-M2 switch, I went with a pair of 10GTEK 10GBase-SR SFP+ LC Transceivers and a 7 inch OM4 Fiber LC to LC cable. My main ISP uses not one, but two devices for internet connection: their Fiber ONT device and a modem-router device. I managed to delete the router, and I’m now waiting on an ONT stick in order to direct-connect the fiber to my pfSense box.
Here’s a comparison of your options for connecting via SFP+:
- Plain CAT 6a, plug and play 10GBase-T modules convenient, but dissipate up to 5 watts, so they run pretty hot. Keep the hop under 15 meters, or you’ll pay in heat as you get closer to 30 meters.
- Passive DAC (Direct Attach Copper) twin-ax is the cheapest way to connect a 10 Gb link inside the rack (up to ~7 m). It’s essentially two SFP+ ends bonded by copper; no optics, <0.5 W, not much heat generated.
- Fiber (LC multimode, 10 G SR optics) breezes past 30 m connections, laughs at EMI (Electromagnetic Interference) and lowest power at ~ 1 W. Two SR modules plus a short OM4 patch cable usually cost less than a pair of RJ-45 10GBase-T transceivers.
| Type | 10GBASE-T SFP+ (RJ-45) | Passive DAC SFP+ | Fiber SFP+ (SR) |
|---|---|---|---|
| Max Distance | ≤ 30 m (Short RJ-45 runs) | ≤ 7 m (Intra-rack) | 300 m (Long or EMI-prone runs) |
| Power Draw | 2 to 5 W | < 0.5 W | ~ 1 W |
| Heat | Moderate (needs airflow) | Minimal | Low |
| Cost (pair) | Moderate | Lowest | Moderate |
| EMI Immune? | No | No | Yes |
| Recommended Model | H!Fiber 10Gb Transceiver | 10Gtek SFP+ DAC Twinax | 10GTEK 10GBase-SR |
Removing my ISP’s ONT (Optical Network Terminal)

Rest in peace, ISP router. An electricity leach @ ~20 watts.
As mentioned above, I was able to get rid of the ISP’s modem/router box and plug the RJ-45 cable from the ONT directly into my second SFP+ port on the pfSense firewall. I did this by spoofing the mac address of the ISP device and then cloning the PPPoE connection. The PPPoE config was not visible in the UI of the device, so I had to download the config using the UI’s backup feature and found everything needed in the exported text config file.
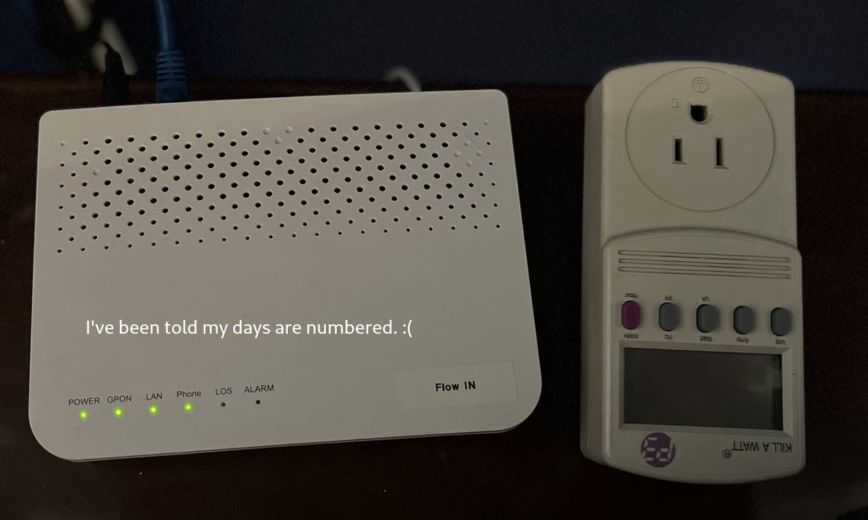
Hopefully, the GPON stick works so I can unplug this ONT and save ~10 watts.
The ONT is already set to pass-through mode, so it’s solely there to terminate the fiber. PfSense is already handling connecting to my ISP. Mainly, now, it’s just a waste of electricity and an additional failure point. But first, I’ll need a GPON stick. I just ordered one on eBay for $20 (while writing this they cancelled my order and said due to shipping and taxes I have to pay $35).
Please check your specific ISP requirements, but here’s an comparison of GPON SFP modules specific to my setup for ONT delete (sometimes called an “ONT-stick”, “mini-ONT” or “PON-stick”):
| Model | Chipset | Connector | Notes |
|---|---|---|---|
| Sercomm FGS202 | Lantiq PEB98036 | SC/APC inside SFP shell | Same vendor as my FG1000R; already built to talk GPON OLTs with Sercomm profile. |
| FS GPON-ONU-34-20BI | Broadcom B+ class | LC/UPC | Lets you spoof/clone LOID/SN via CLI; widely documented. |
| Nokia G-010S-A / G-010S-P | Broadcom | SC/APC | Works on many Huawei/Calix OLTs after the ISP whitelists the module’s serial number. |
| Ubiquiti UF-Instant | Realtek | LC/UPC | User-friendly web UI, but some OLTs reject non-Broadcom sticks. |
pfSense 2.8 Installation
I’m not going into great detail. Because the pfSense 2.8.0 (2.8.*) installation process is pretty simple. However, I will include a few tips and comments.
BIOS and booting checklist
These were my settings for my n100 (fan disabled) pfSense install. The N100 is overkill for most setups. But it’s cheap, runs cool and very well proven with lots of online documentation, and discussions specific to pfSense:
- Secure Boot: disable it because it blocks the booting pfSense.
- Restore power on AC Power Loss: Set to ‘Power On’ so that pfSense will automatically boot when power is restored after a power loss.
- Fan profile: choose “Balanced” or “Off” for CPUs like the N100 which run really cool. Also see: N100 Fans Don’t Turn Off. If all else fails, you can unplug the fan.
- Boot delay: Still in system BIOS, don’t remove the default 3-second pause! Keeping this allows the hardware a little extra breathing room to fully initialize before pfSense begins probing interfaces. If you remove the BIOS boot 3-second delay, NICs sometimes aren’t 100% ready, kernel sees up/down flapping events, pfSense triggers package/service restarts, and it results in slower problematic startups. I experienced this first hand, so sharing.
- Reduce or remove pfSense boot delay: On the other hand, this IS safe! Use either the System → Advanced → System Tunables or manually create
/conf/loader.conf.localwith:autoboot_delay="-1"to remove completely orautoboot_delay="1"to reduce delay to 1 second. - With these settings, rebooting takes ~ 60 seconds, even with IDS/IPS packages installed.
Grab a clean image
- Head to Downloads ▸ pfSense CE and pull the latest amd64 ISO.
- Verify it before you touch a USB key:
sha256sum pfSense-CE-*.isoCompare against the SHA-256 string on the download page; mismatches mean re-download.
Write the installer to a USB
I used balenaEtcher.
You can also use Linux CLI:
sudo dd if=pfSense-CE-*.iso of=/dev/sdX bs=1M status=progress && sync
Replace /dev/sdX with your flash-drive path.
On macOS use balenaEtcher or sudo diskutil unmountDisk /dev/diskN then dd.
Windows users: balenaEtcher or Rufus.
Boot and run the pfSense installer
- Insert the USB, hit your board’s boot menu, choose the USB device. (Walkthrough)
- At the pfSense splash, accept defaults → Install → keymap (your language)→ filesystem *ZFS**.
- Reboot when prompted; remove the stick.
Complete the first-boot wizard
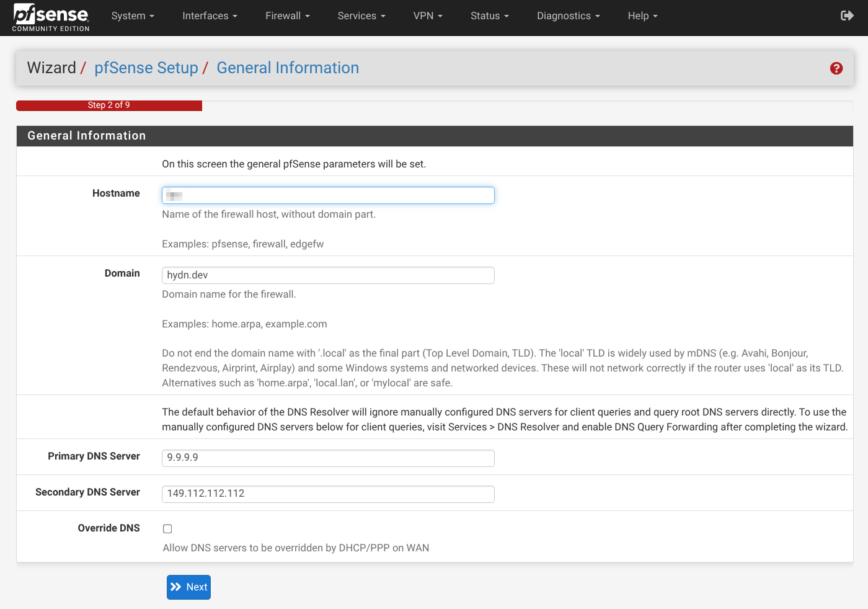
I like to use Cloudflare or Quad9.
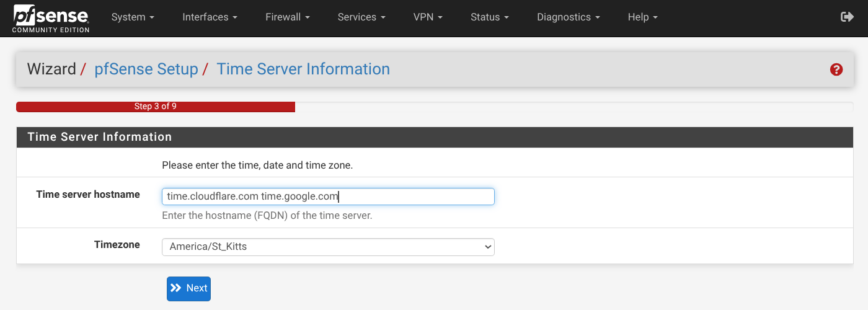
I use time.cloudflare.com and time.google.com.

Use defaults for DHCP. Keep everything else default for now.
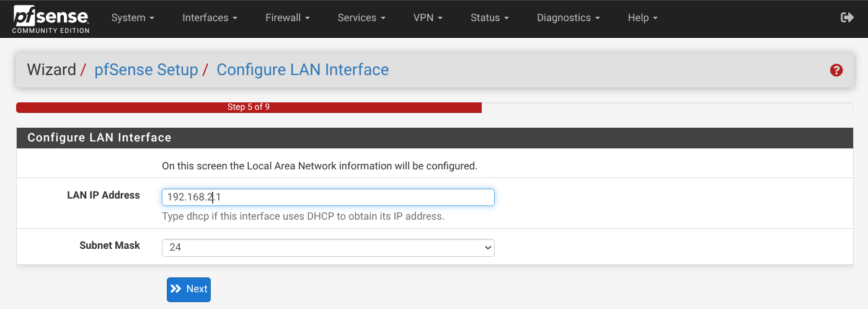
Set LAN IP address to your preference. Click next, then set password.

Finally, click reload and then continue from there.
Now open https://192.168.1.1 (or the IP you assigned), accept the self-signed cert warning, then sign in. That’s it, pfSense 2.8.0 is not installed, let’s go!
Also read: 10 pfSense Setup Changes to Make Post Install.
pfSense System settings walkthrough
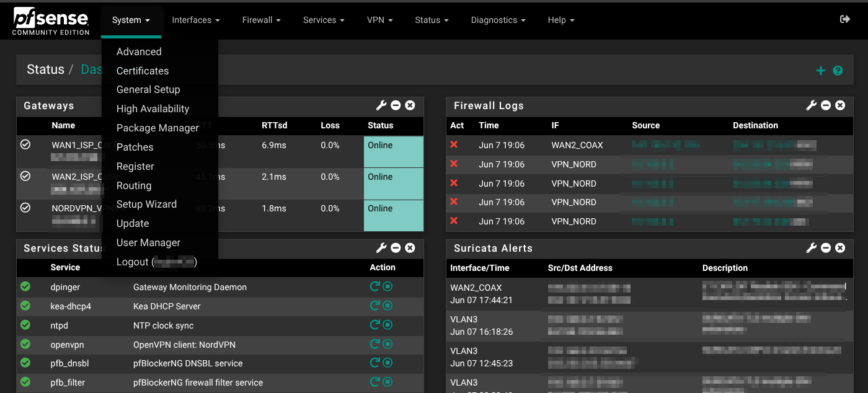
Let’s begin from left-to-right in the navigation bar at the top of the pfSense UI. Starting with the ‘system‘ menu. The first drop-down on the pfSense navigation bar. This is where you tell the firewall who it is, how it keeps time, which DNS servers it trusts, and how you, and only you, get through the admin door.
A couple of minutes in General Setup and Advanced locks the GUI behind HTTPS on a quiet port, routes all look-ups through a filtered resolver, and enables the CPU’s AES instructions so every future VPN or TLS handshake runs at full speed. Many of these essential settings we already covered in the previous section.
Moving on, the same menu also houses the day-to-day plumbing: extra packages, user accounts, and the gateway group that lets the box fail over ISPs without dropping a beat. Configure these early and every setting that follows—DHCP scopes, IDS/IPS, even the dashboard graphs, inherits a clean, trusted baseline. Below is an overview of my settings.
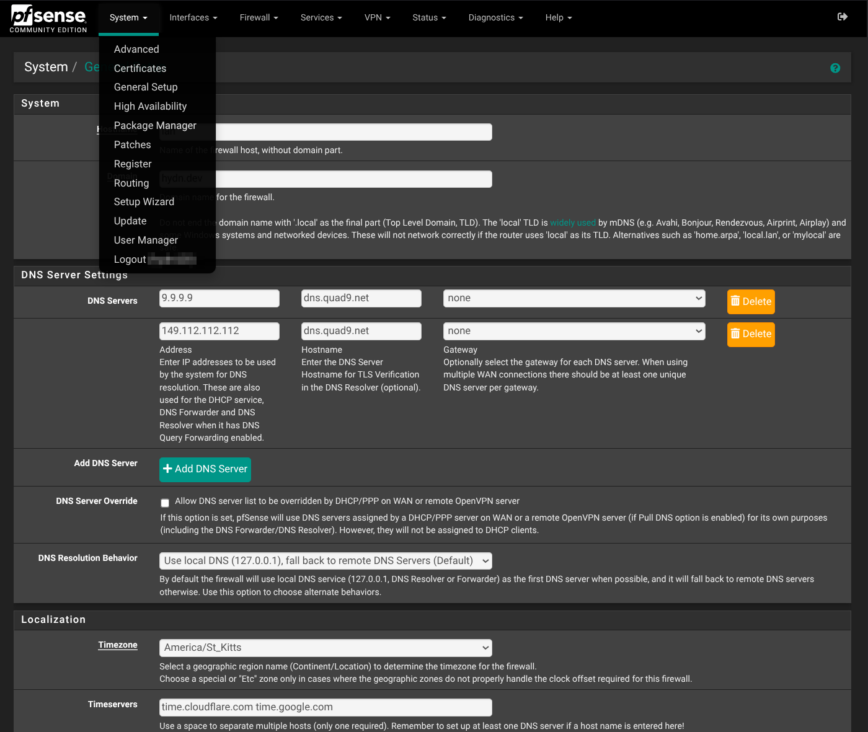
General Setup
- Hostname / domain:
hostname.hydn.devties local services and to my personal namespace. - Timezone:
America/St_Kittskeeps log time-stamps square with your location. - DNS servers: Quad9 primary/secondary
9.9.9.9 / 149.112.112.112. Quad9 DNS blocks malware, phishing, spyware, and botnets. You can also use Cloudflare’s DNS. - NTP pool:
time.cloudflare.comfollowed bytime.google.com.
Advanced (System → Advanced)
- WebGUI hardening: GUI is HTTPS-only on non-standard port, autocomplete disabled and an alternate host list (
myaccountname.cloudflareaccess.com) for Cloudflare Zero-Trust can front-end it while keeping WAN ports closed. - GUI certificate: Presented cert is GUI default a self-signed RSA created at install.
- SSH access: Disabled but when enabled is also on non-standard Port, key-only auth. SSHGuard blocks a source after x bad logins for x hours (tweak to your preference).
- Hardware tweaks: AES-NI crypto enabled, thermal set to Intel, and NAT reflection is pure-NAT.
SMTP notifications
System > Advanced > Notifications: The system is set up to send mail (notifications) using my Postmarkapp account on TLS with my unique token.
User Manager
- admin (uid 0) is the built-in root with shell access, login disabled.
- myusrname is the day-to-day admin account, member of admins but without a shell for extra safety.
Package Manager
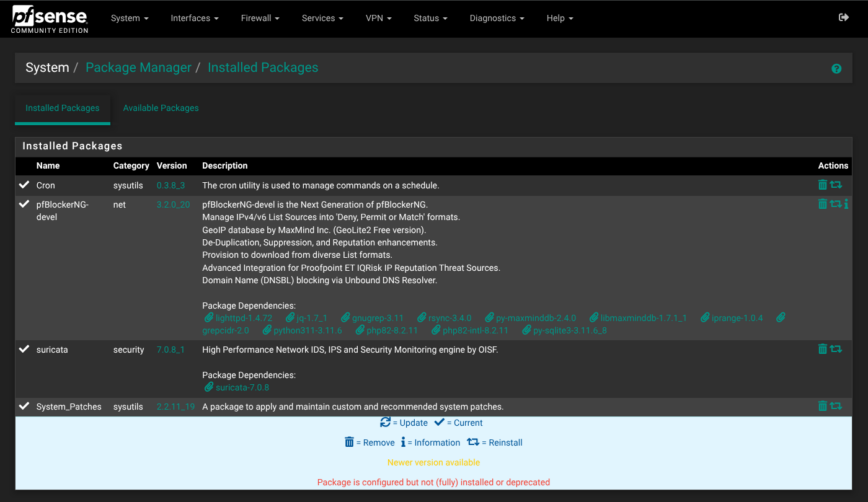
My installed packages:
- pfBlockerNG-devel: IP blocking and DNS geo and content filtering with DNSBL.
- Suricata: IDS in IPS-inline mode on WANs, alert logs pruned after 14 days.
- Cron: A package to apply and maintain custom and recommended system patches.
- System_Patches: A package to apply and maintain custom and recommended system patches.
- Watchdog: Monitors for stopped services and restarts them.
Routing
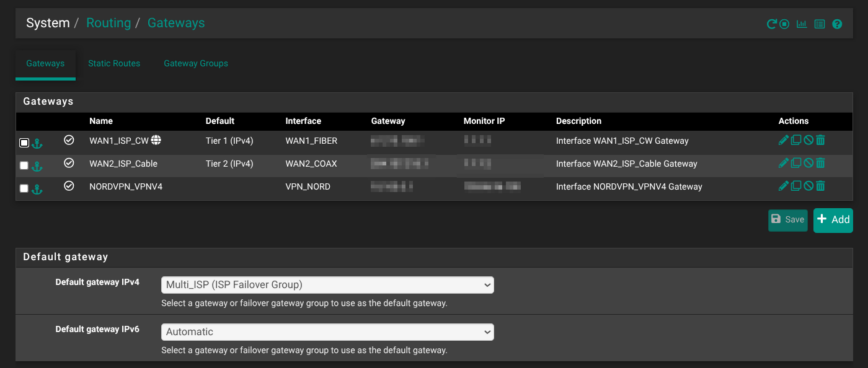
- Gateways: Three dynamic gateways: WAN1_ISP_CW (fiber), WAN2_ISP_Cable (coax), and NORDVPN_VPNV4 (client).
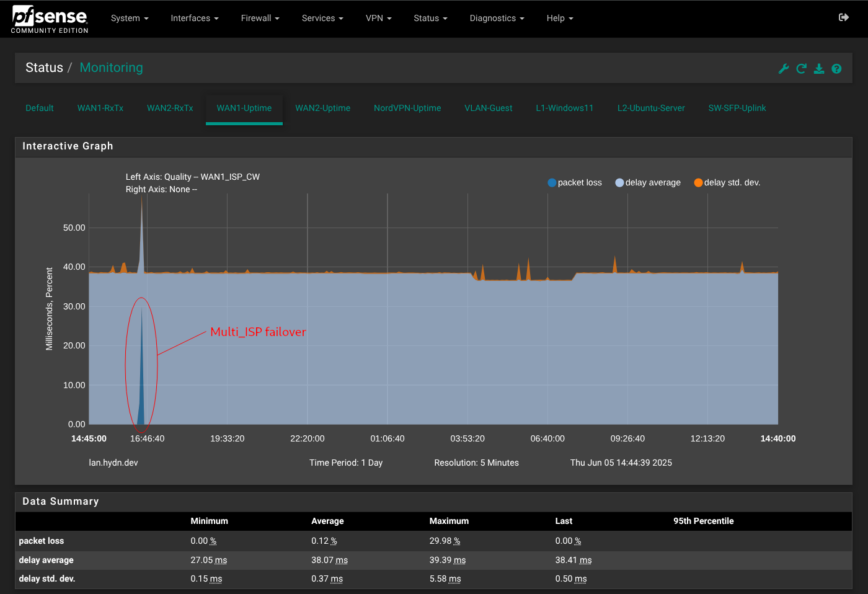
- Gateway group “Multi_ISP”: sets WAN1 Tier-1, WAN2 Tier-2 with trigger down/packet-loss/latency, giving automatic fail-over while avoiding flaps during brief jitter.
- Default Gateway IPv4: points to the group; IPv6 disabled everywhere.
Network Interfaces config — Assignments, VLANs, and WAN links
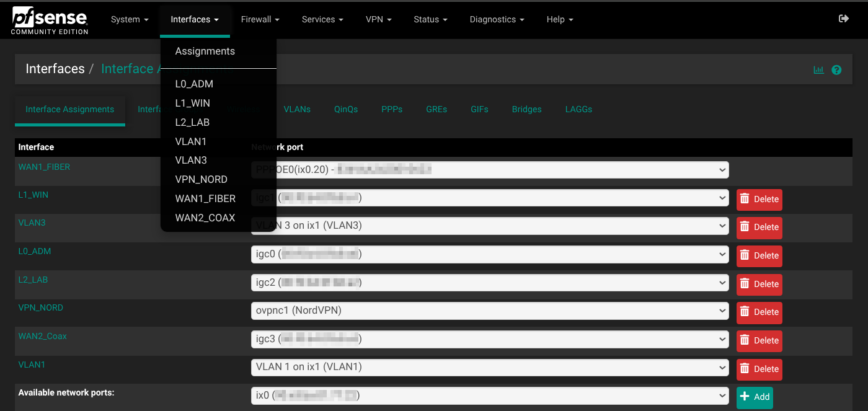
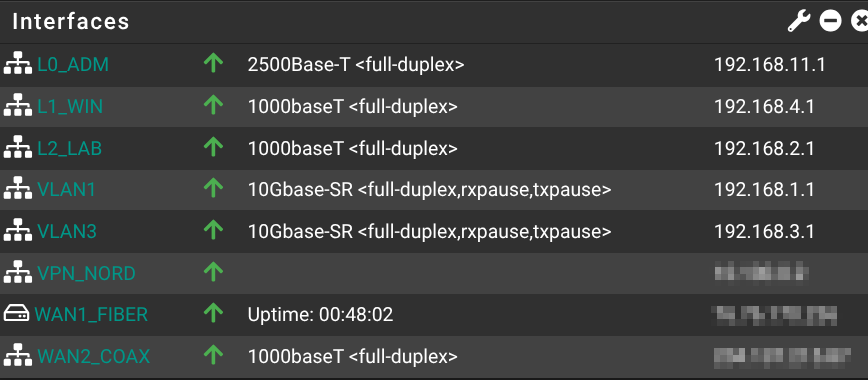
Before any firewall rules or packages can do their job, the box needs a solid interface blueprint. Mine carves the network into clear-cut zones, each with its own Layer-3 IP space: an admin LAN on 192.168.11.0/24, a Windows LAN on 192.168.4.0/24, a Homelab LAN on 192.168.2.0/24, and an IoT/guest VLAN on 192.168.3.0/24. That separation lets stateful rules decide, down to the byte, who can talk to whom.
Physical layout follows function
Read more about this box: My $300 pfSense Firewall Appliance – Part 1: Unboxing
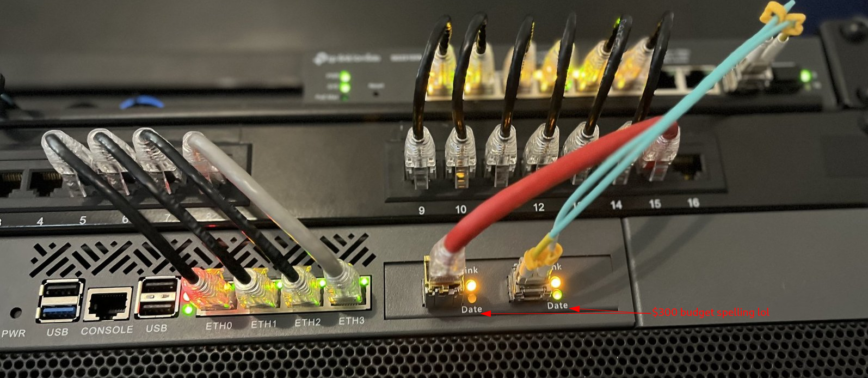
The 10G port ix1 carries both management (tag 1) and guest (tag 3) traffic to the 10G SFP+ port on my multigig switch, where eight 2.5 Gb ports fan out to my IoT hardware (with some unused for future expansion).
For internet, ix0 tags VLAN 20 for the fiber ISP’s PPPoE hand-off, while igc3 (ETH3) keeps a DHCP cable link as fail-over; pfSense lumps them into a Multi_ISP gateway group so latency or packet-loss flips routes automatically. A NordVPN tunnel shows up as ovpnc1, giving policy-based routing the same knobs as any WAN. This is handy for pushing only the IoT VLAN through a privacy exit without floating-rules.
From here, firewall policies, DHCP scopes, and IDS sensors slot into place:
| Interface Assignments | Physical port | Type | IPv4 / Mask | Role |
|---|---|---|---|---|
| WAN1_FIBER (ix0 fiber) | pppoe0 → ix0.20 | PPPoE on VLAN 20 | Dynamic | Primary ISP (fiber) |
| WAN2_Coax | igc3 | DHCP | Dynamic | Backup ISP (cable) |
| VPN_NORD | ovpnc1 | OpenVPN client | — | NordVPN for VLAN3 |
| L0_ADM | igc0 | Static IPv4 | 192.168.11.1/24 | Admin-only LAN |
| L1_WIN | igc1 | Static IPv4 | 192.168.4.1/24 | Windows devices |
| L2_LAB | igc2 | Static IPv4 | 192.168.2.1/24 | Home-lab devices |
| VLAN1 (ix1 fiber sw uplink) | ix1.1 (tag 1) | Static IPv4 | 192.168.1.1/24 | Wired & Wi-Fi LAN |
| VLAN3 (ix1 fiber sw uplink) | ix1.3 (tag 3) | Static IPv4 | 192.168.3.1/24 | Guest Wi-Fi / IoT devices |
Why this layout works for me
- Clear separation – each security zone (admin, lab, IoT/guest) has its own Layer-3 interface, so stateful rules can isolate or allow traffic precisely where I need.
- 10 Gb trunk –
ix1carries both management VLAN 1 and guest VLAN 3 to my 10 GB switch, which has eight 2.5 GB LAN ports. - Dual-WAN resilience – fiber ISP (Tier 1) and cable ISP (Tier 2) are fed into a gateway group Multi_ISP that fails over on loss/latency; pfSense sets that group as the IPv4 default route.
- Clean PPPoE – the FTTH provider requires VLAN 20 in order to replace their modem device; tagging happens on
ix0.20, then PPPoE createspppoe0. - VPN as an interface – having NordVPN on
ovpnc1lets me make policy-routing and NAT rules just like any other WAN, instead of having to use floating rules.


Firewall — Aliases, NAT, Rules
The Firewall menu is where the design you mapped out in Interfaces turns into concrete, enforceable policies. I started by building a list of aliases—IP, network and port groups. With names such as Ring_Cams or Web_TCP, a single edit later can ripple through dozens of rules without hunting for scattered addresses.
Because a Cloudflare Tunnel fronts the primary WAN for the hydn.dev website, Checkmk, the Unifi controller, the network switch, remote printing and other services, inbound NAT is almost nonexistent; the box handles only a pair of port-forwards on the backup WAN2, restricted to specific allowed ports and IPs.
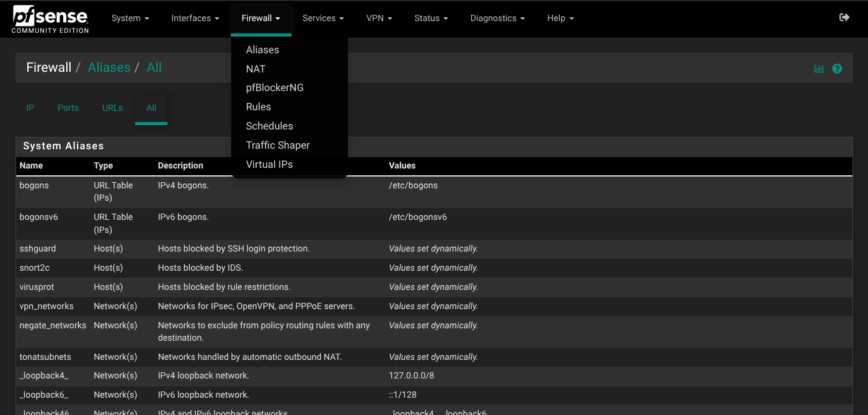
Let’s go over some of the config.
Aliases – the Lego-bricks for firewall rules
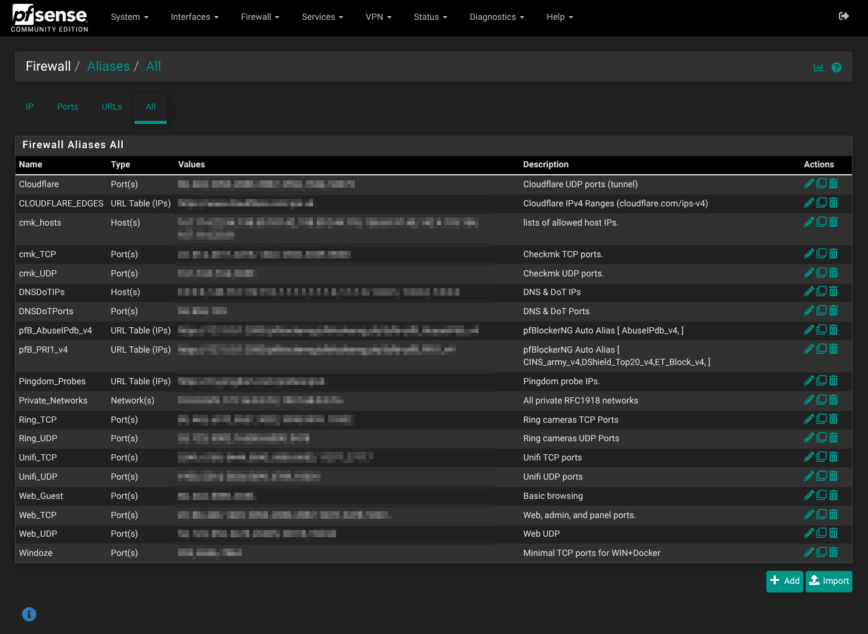
PfSense lets you build reusable address/port groups (“aliases”) so rules stay readable and easier to manage. My config holds several aliases spanning IPs, Ports, URLs, and networks:
| Type | Examples | Purpose |
|---|---|---|
| Port/IPs | Windows, Web browsing, Security/IoT bundles such as Ring, Unifi doorbell, cams, APs, controller. |
Bundle many TCP/UDP service ports. |
| Network / Host | RFC1918 networks, DoT IPs/ports, Checkmk |
Reference entire subnets or key hosts without hard-coding individual IPs. |
| URL Table | Pingdom Probes IPs, Cloudflare IPv4 ranges, pfBlockerNG auto-generated lists |
Pull external TXT/IP lists on a schedule (e.g. Pingdom probe list, threat feeds). |
Adding and organizing Aliases pays dividends later when you need to make changes.
NAT (Network Address Translation)
As mentioned I’m making use of Cloudflare Tunnels via Zero trust. So my front facing ISP WAN1 has all incoming ports closed and firewall rules set to drop all unsolicited incoming traffic. Check/test your with routersecurity.org.
Port-forward snapshot
On WAN2, Two port forwarding rules expose Checkmk server which runs on a VM on Win 11 ThinkCentre-M75 box (192.168.4.109) to the alias cmk_hosts (access restricted to this IP list):

Firewall Rules
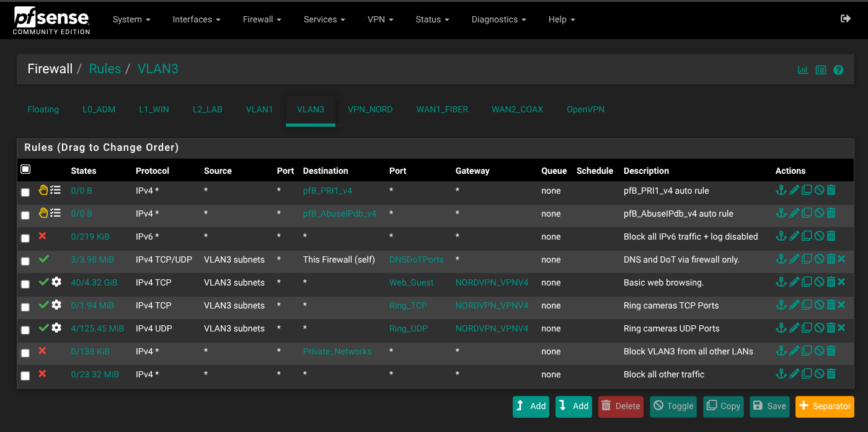
IPv6 traffic is globally blocked on all interfaces silently to reduce logs/noise. pfBlockerNG rules sit at the top and my custom rules follow. As an example, here are a few screenshots of my rules. Suggestions welcomed:
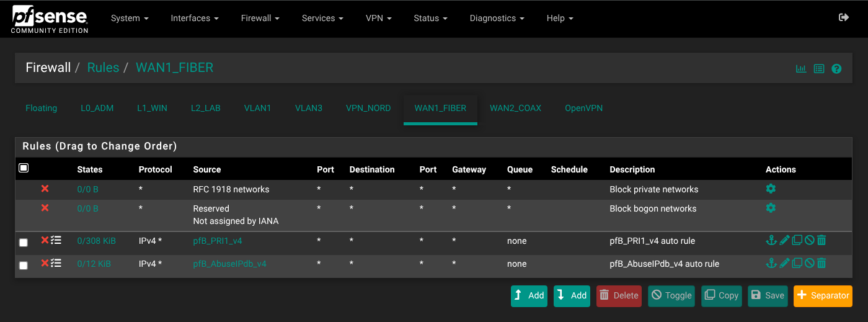
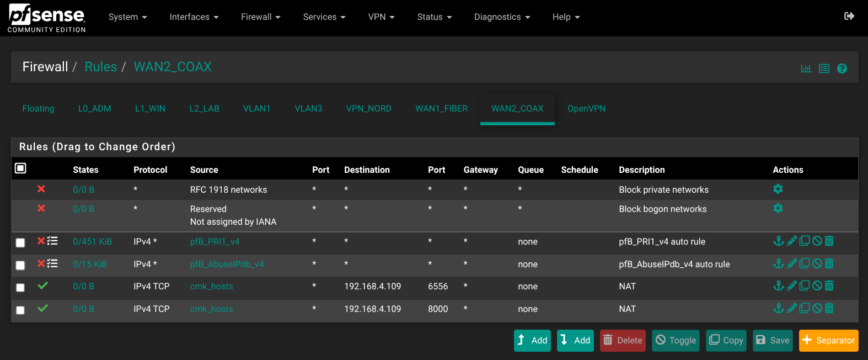
Firewall — pfBlockerNG IP, DNSBL Blocking
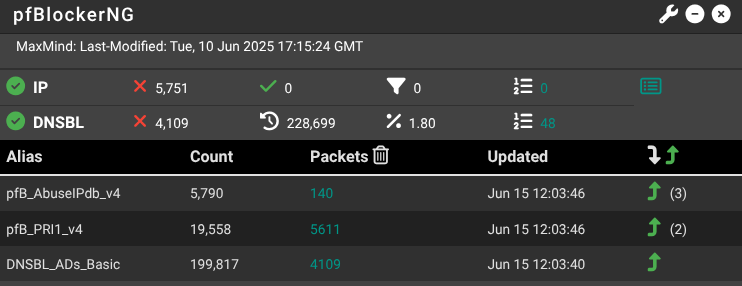
pfBlockerNG is used to pull CINS Army, DShield, and Emerging-Threats intopfB_PRI1_v4.
Note: The default pfBlockerNG selected lists include a couple of deprecated and broken links, so feel free to use and improve on my list below:
| Feed/URL | Description | Approx. unique IPs |
|---|---|---|
| CINS Army “CI Bad Guys” | High-confidence attacker list built from a global network of honeypots; refreshed ~12-hourly. | ≈ 15000 |
| DShield Top Attackers (7-day aggregate) |
Rolling set of the most aggressive /24 subnets seen scanning the Internet in the last three days; FireHOL keeps seven days of history. | ≈ 10000 (37 /24 nets) |
| Emerging Threats “Block IPs” | Composite feed (Spamhaus DROP + DShield + Abuse.ch); updated twice daily for broad, catch-all blocking. | ≈ 15 million |
There is about 65% overlap between DShield and ET. Still, I kept both feeds because pfBlockerNG deduplicates IPs before they ever reach the firewall table, so the overlap costs no extra states, no extra memory, and no extra processing time. Whereas, what I’d lose by dropping one list is the 35% that doesn’t overlap. I’ll continue to compare the two and may replace if I find better. Recommendations are welcome.
pfBlockerNG Feeds
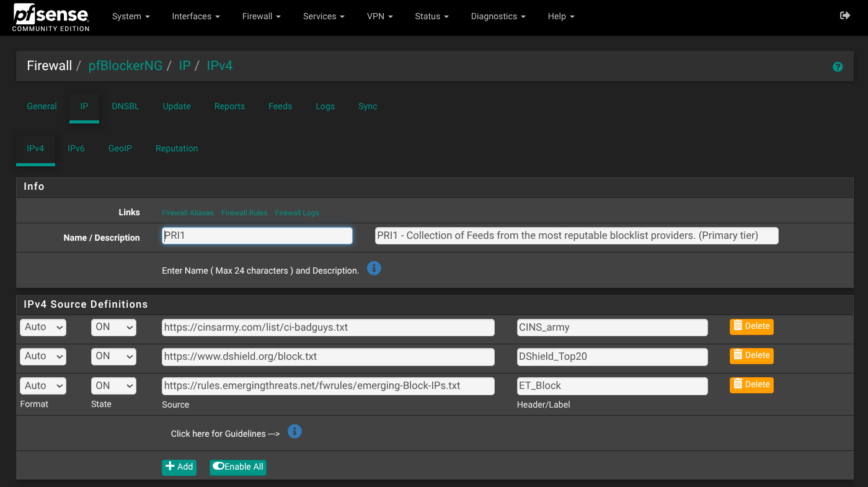
pfBlockerNG is set to automatically inject drop rules on WAN2, Windows LAN and the Guest/IoT VLAN interfaces, so that any packets matching the above feeds are dropped even before the default pfSense firewall rules run. I tried my best to focus on feeds that are well-respected, actively updated, and have low false-positives. For
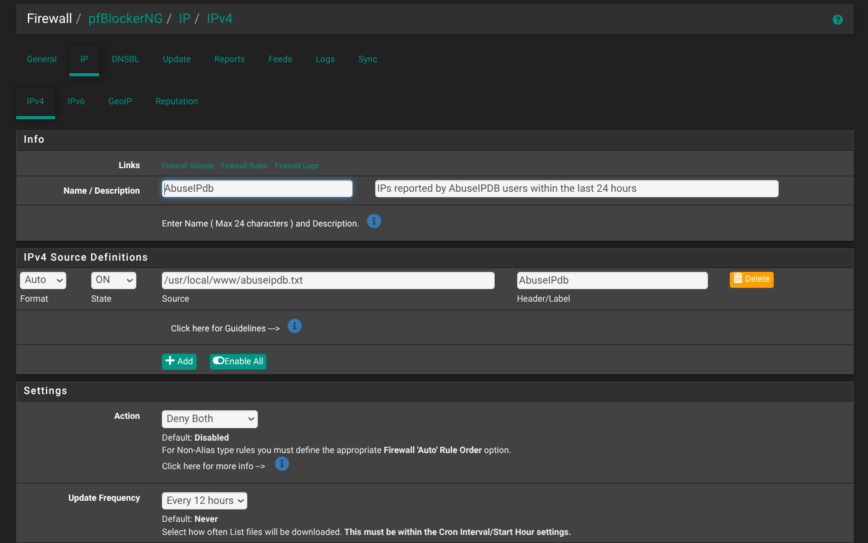
I’m using AbuseIPDB feed in pfB_AbuseIPdb_v4 on a 12-hour refresh. Also consider adding FireHOL_L2. However, it can be very noisy to logs on LAN interfaces.
pfBlockerNG DNSBL
For DNSBL, I’m currently not using GeoIP. I did briefly, but I think it’s overkill and prone to false positives depending on the countries blocked. If you do use it, I wouldn’t recommend mass blocking of countries. It’s easy to get carried away! I’ve seen admins just 1 or 2 major countries they are 100% sure will have no need to reach their network. Even then, maybe just block inbound, or outbound, not both. It really varies depending on each network. For me, I decided to disable GeoIP DNSBL.
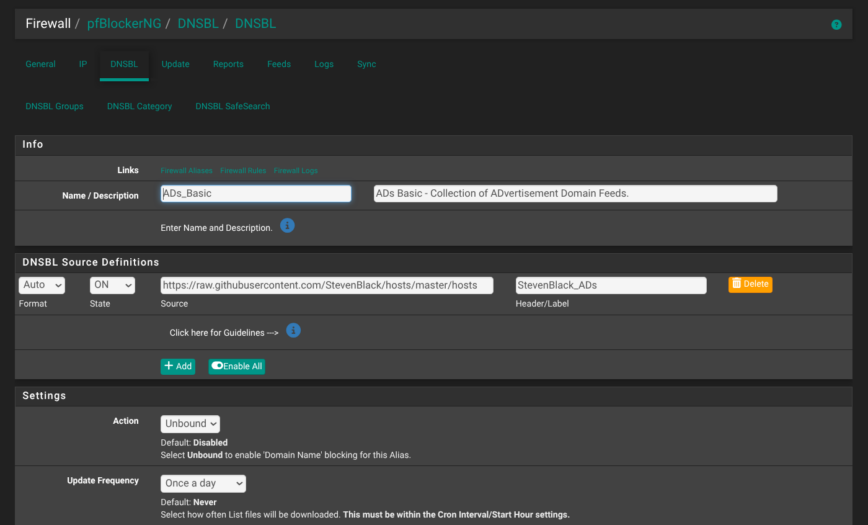
That said, I’m using Steven Black’s list — consolidating and extending hosts files from several well-curated sources. Which has been very effective while also super-simple to allow any sites I need to visit:
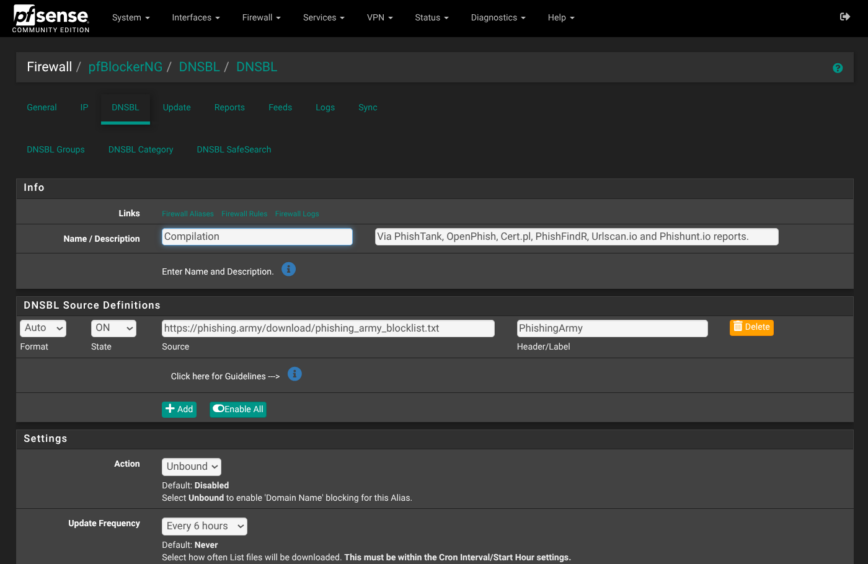
On networks with higher risk, such as those used by kids or transient users, you might also consider adding PhishingArmy which is a compilation of PhishTank, OpenPhish, Cert.pl, PhishFindR, Urlscan.io and Phishunt.io reports:
Services — DNS Resolver, DHCP and NTP
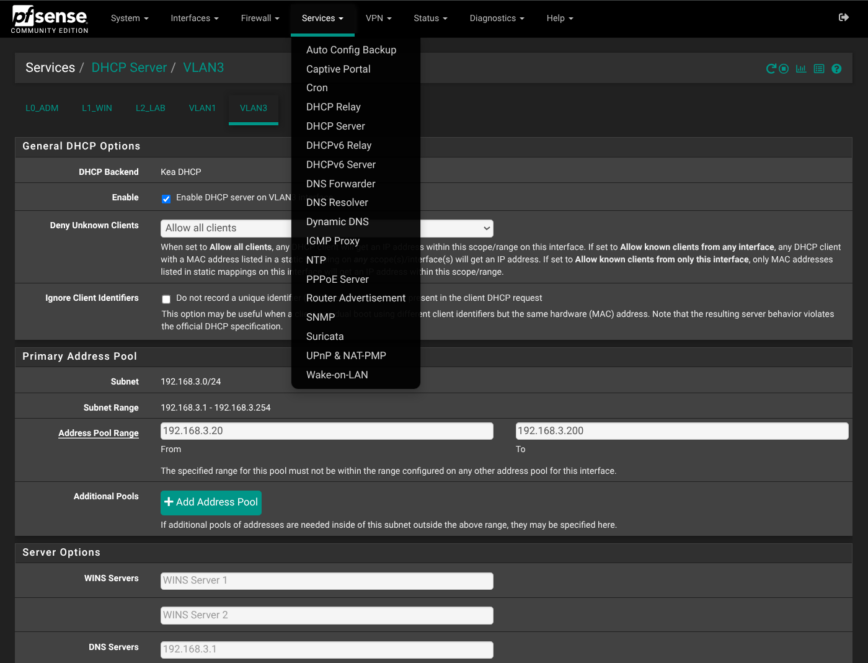
The Services menu is where the box acts like the nervous system of the network: handing out IP leases, resolving names, and keeping everything in sync. It’s here that we lean on three core daemons:
-
DNS Resolver (Unbound): for encrypted, policy-aware name look-ups.
-
DHCP Server (kea-dhcp4): to parcel out addresses and gateways.
-
NTP (ntpd): so logs and certificates all agree on the same timeline.
The goal is to keep each one as simple as possible while still gaining the speed of local caching, the convenience of per-VLAN pools, and the reliability of good time.
DNS Resolver (Unbound)
Unbound is running and bound to all interfaces for both listening and outgoing queries. You only need two DNS server entries (a pair), add a third DNS provider if worried about DNS outages, which are extremely rare for both Cloudflare and Quad9. Cloudflare offers lower latency than Quad9, while Quad9 offers better malware blocking and privacy.
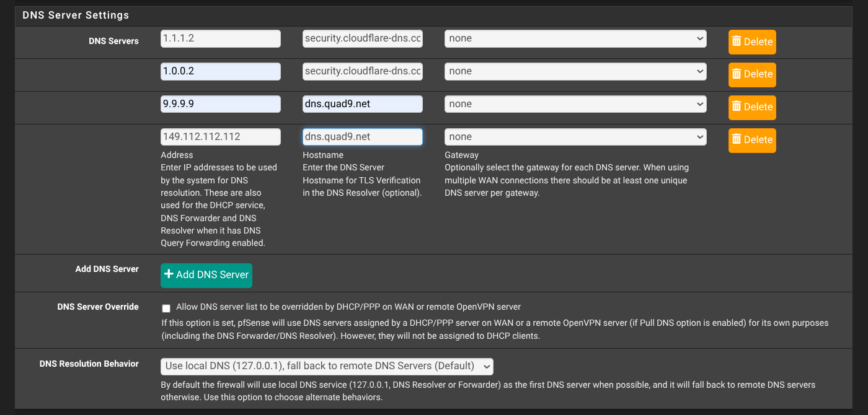
Also, I enabled forward TLS upstream, to my preferred DoT endpoints so that all queries are TLS encrypted beyond pfSense in Services > DNS Resolver > General Settings:
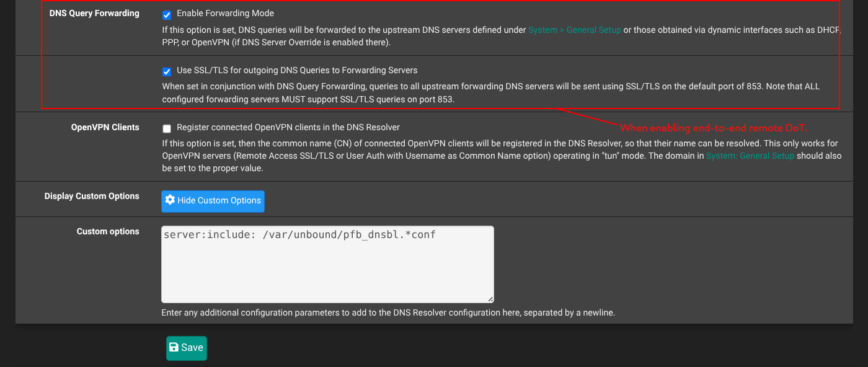
Added dedicated “DoT” (DNS over TLS) allow rule (drop all other DNS traffic):
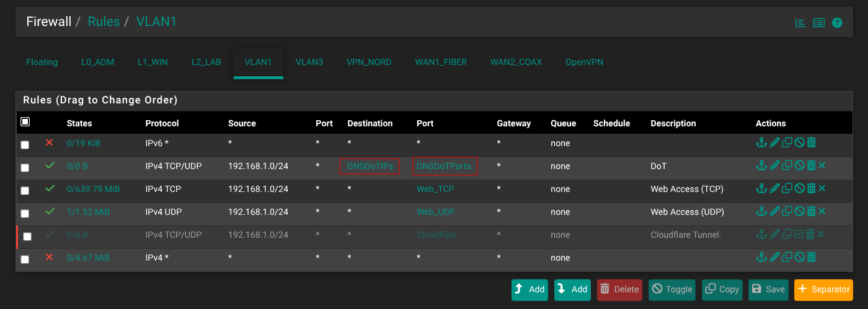
The result of these changes seen in the below screenshot when visiting the Cloudflare DNS debug/test page — https://one.one.one.one/help/:
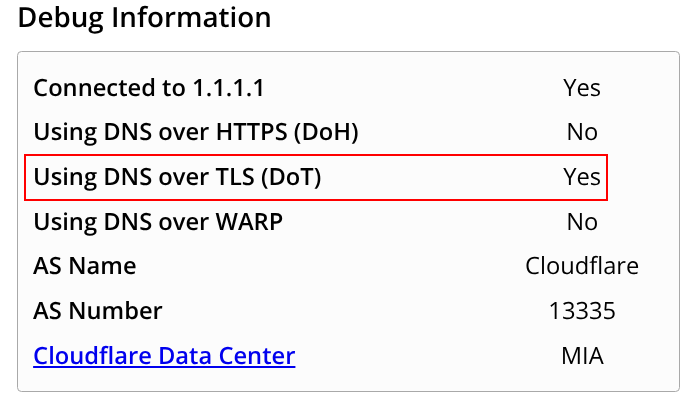
Note, you must also set your DNS IPs AND hostnames in System > General Setup:
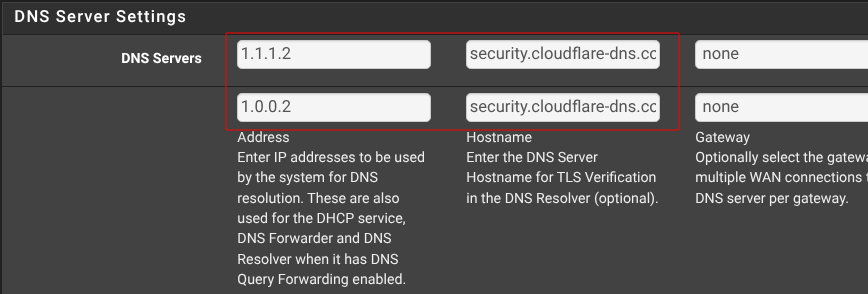
Find the hostname you need you use for Cloudflare or Quad9.
DHCP Server (kea-dhcp4)
Kea DHCP4 manages DHCP for the following pfSense interfaces:
| Interface | DHCP Pool | Notes |
|---|---|---|
| Admin (LAN 0) | 192.168.11.100 – 192.168.11.150 | Management devices |
| Windows (LAN 1) | 192.168.4.100 – 192.168.4.150 | Desktops / VMs |
| Home Lab (LAN 2) | 192.168.2.150 – 192.168.2.200 | Home-lab VLAN-aware (ex. Unifi Controller) |
| VLAN 1 (Trusted LAN + Wi-Fi) | 192.168.1.100 – 192.168.1.200 | 10 Gb back-bone (ix1) |
| VLAN 3 (Guest Wi-FI SSID/IoT devices) | 192.168.3.20 – 192.168.3.200 | Guest Wi-Fi & cameras (ix1) |
My NTP settings
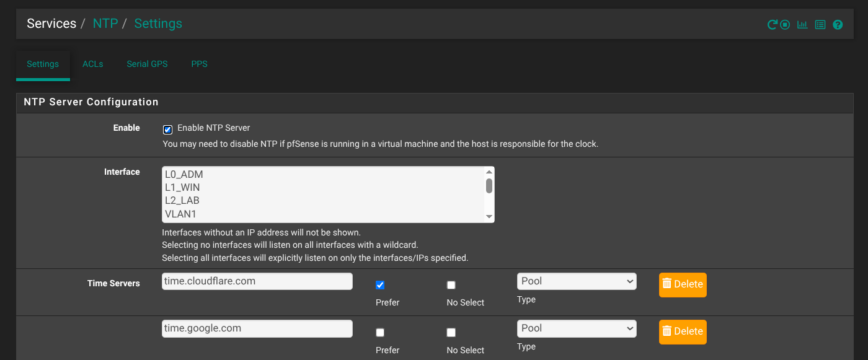
To ensure consistent timekeeping across, I’ve enabled pfSense’s built-in NTP server. It syncs against two trusted public time sources: time.cloudflare.com and time.google.com. Both known for their reliability and low jitter. Cloudflare is set as preferred.
Services — Suricata
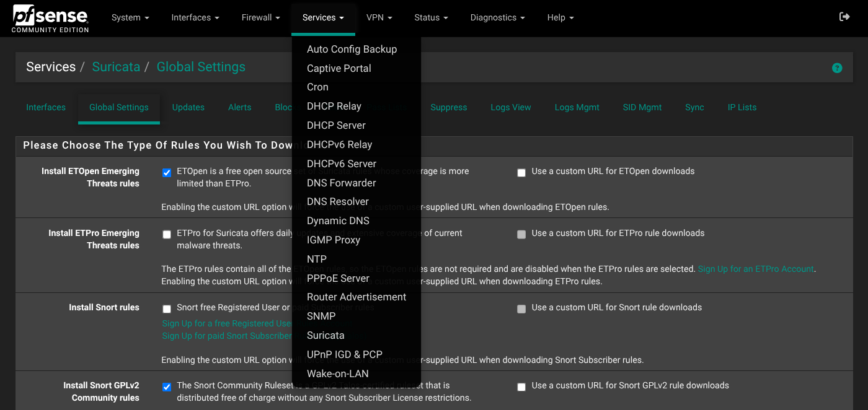
With the core firewall rules and PFBlockerNG in place, it’s time to add Suricata as a second firewall security layer IDS/IPS. Another option is to SKIP adding PGBlockerNG if you prefer the IDS analytics of Suricata. Suricata also has IP reputation blocking as well as additional feeds that you can enable.
For Suricate, I skipped WAN1_FIBER where firewall rules blocks all incoming traffic because all ports are set to closed, and instead focused inline IPS on WAN2_Coax where a few ports are open.
I have Suricata also enabled on VLAN3 (Guest/IoT) and L1_WIN (for Windows devices) so I can monitor (IDS) traffic. Traffic now flows through three security layers—pfBlockerNG first, Suricata next, and finally, my pfSense firewall rules:
• IP & GeoIP feeds/tables
• DNSBL filters (DNS query level, not packet level)
• Signature matching (ETOpen, Snort GPLv2 rules)
• Automatic SID management (drops, disabled rules)
• Drop all IPv6 traffic
• Interface Pass / Drop / Reject rules
Suricata — Global Settings & Rule Downloads

In the Suricata Global Settings page, you’ll see a handful of rule categories ready to download. I’ve opted to enable the ETOpen Emerging Threats rules. This gives a solid, community-maintained baseline without the complexity or cost of ETPro or paid Snort feeds.
Just below it, I’ve also enabled the Snort GPLv2 Community ruleset (the Talos-certified subset), which rounds out coverage for the most common threat signatures. To keep the interface clean, the Hide deprecated rules categories option is checked, so you’re not distracted by legacy rule groups you’ll never use.
Finally, the update interval is set to “1 DAY” with a randomized start minute. This ensures you get fresh rules every 24 hours without hammering the download servers.
Suricata Enabled Interfaces

In the Suricata Interfaces Settings Overview, you can see three Suricata instances that use IDS on: WAN2_Coax (igc3), VLAN3 (ix1.3) and L1_WIN (igc1). All configured for HS (High-speed) pattern matching (more efficient CPU performance). WAN2 is also running IPS (intrusion prevention system) Inline IPS mode, so threats are automatically blocked, while VLAN3 and L1_WIN remain in alert-only mode with blocking disabled until I’ve had more time to understand their traffic profiles better in the coming weeks. I’ve been learning so much, patience is key!
Update: After doing some more research, the best practice is to prioritize IDS/IPS on your LAN interfaces and not the WAN interface(s). The reason is that monitoring LAN gives us better visibility into what’s actually happening inside our network, including traffic going out to the internet.
Monitoring the WAN interface generally leads to plenty of false positives because you’re seeing everything hitting your firewall, even the stuff that would be blocked by the default pfSense firewall. You should consider monitoring WAN only if, as in my case (WAN2), you have some open ports exposed to the internet that you cannot — like with most things — 100% guarantee the security of the systems behind them. In this case, it helps detect potential breaches.
In general, focusing Suricata IDS/IPS on LAN interfaces gives us better insights into internal devices and outbound traffic, which is more critical for identifying real threats.
Suricate Per-Interface Settings (WAN2_COAX)
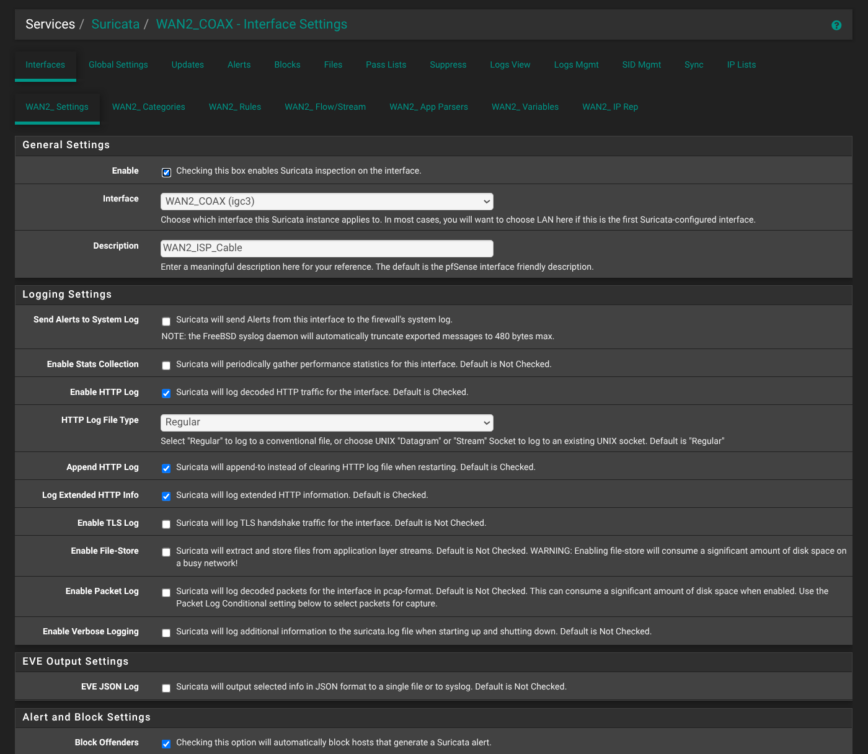
In the WAN2_COAX Suricata interface settings, I’ve enabled Suricata inspection but otherwise left most extras turned off to keep resource use and log noise to a minimum. HTTP logging remains on using the regular file format, in append mode with extended HTTP info. This is so that I can see requests without generating massive dumps.
Down in Alert & Block Settings, the “Block Offenders” box is checked. Any host that trips a signature will be dropped immediately.
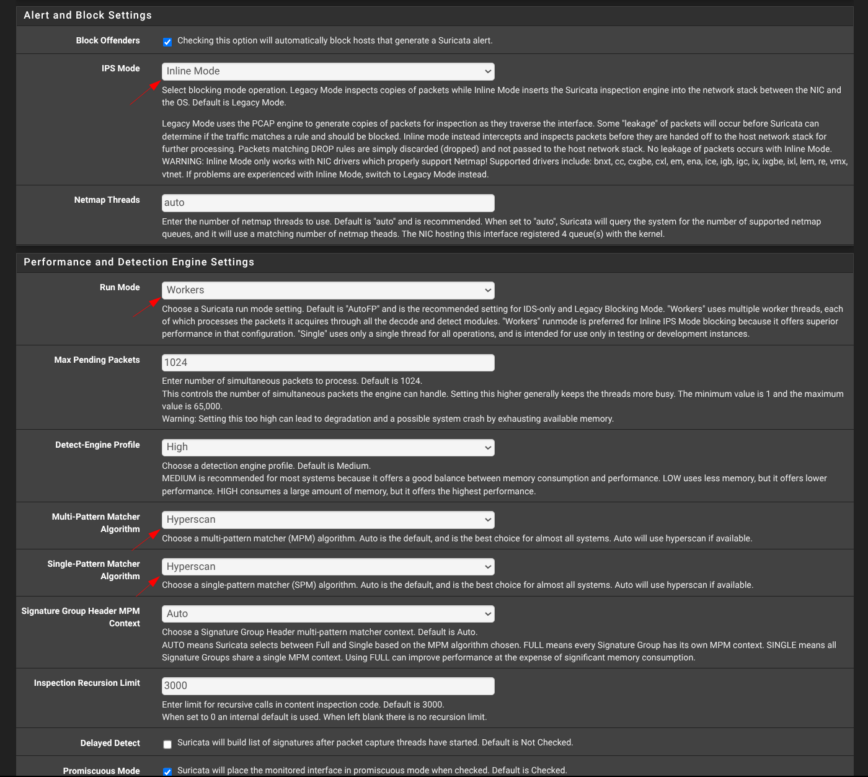
When running Suricata in inline IPS mode, it’s recommended to set the Run Mode to Workers as it allows Suricata to run with multiple dedicated worker threads that process packets in parallel and efficiently. This mode uses zero-copy packet handling, which reduces CPU overhead and latency by not copying packets between kernel and user space.
It also allows for proper CPU affinity, where each worker thread can be pinned to a separate CPU core, for maximum performance and throughput for inline packet inspection and dropping. This is critical for inline IPS as it must process and potentially drop packets in real time without introducing bottlenecks or packet loss. So, setting the Run Mode to Workers ensures Suricata can perform well and be reliable when blocking traffic inline. Source: docs.suricata.io, /r/pfSense/ and forums I’ve been reading.
Suricata Rule Categories
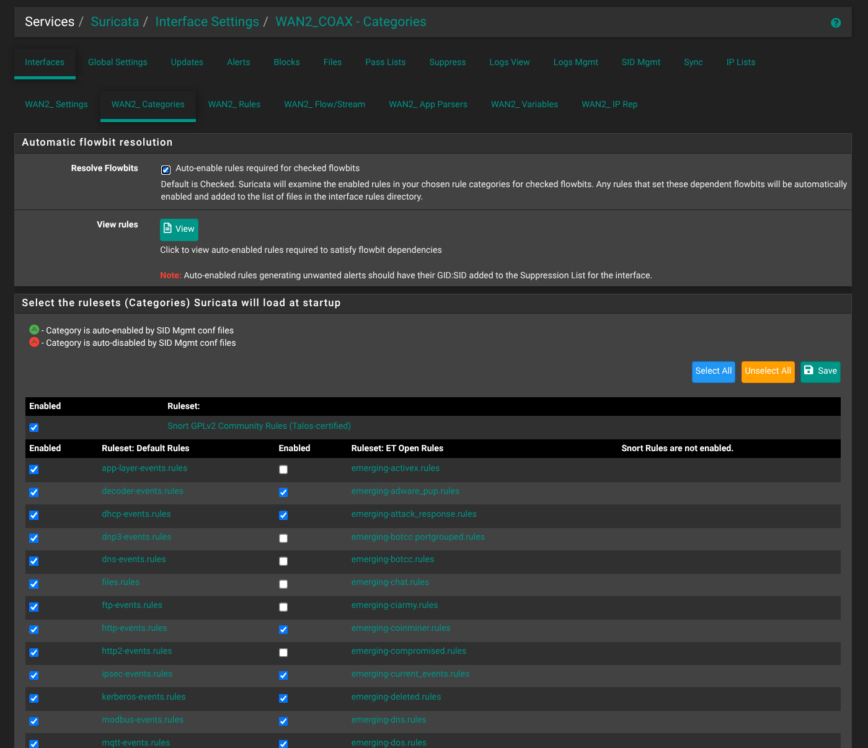
In the Categories tab, Resolve Flowbits is enabled (I believe this is default). Enabled are Talos-certified Snort GPLv2 Community Rules up top (checked for insight into common exploits). Below that, you see three columns of rule sets: the Default Rules, ET Open Emerging-Threats rules and Snort rules. The latter, I didn’t enable.
Suricata SID Management
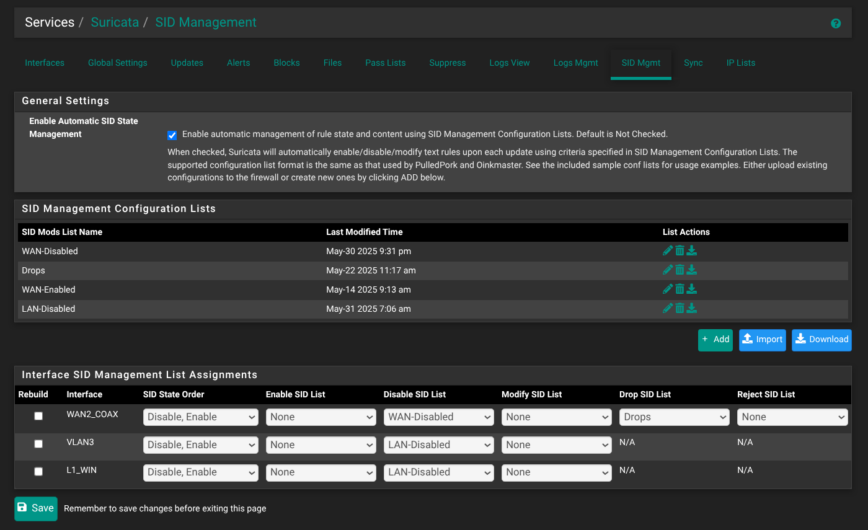
In the SID Management section, allows the system to enable, disable, or drop signatures based on predefined lists, avoiding the need to manually adjust rules after every update.
My configuration includes a list called WAN-Disabled that filters out noisy or redundant signatures on the WAN2 interface. Another list is Drops, this contains high-confidence signatures that should immediately trigger packet drops. WAN-Enabled is blank, have not had the need to use that yet. For internal networks like VLAN3 and L1_WIN, I’m using a separate LAN-Disabled list to hide the flood of low-risk alerts from logs during this learning phase as I observe traffic behavior.
Drop and reject actions are not configured on these LAN interfaces, since they are still in alert-only mode while I monitor traffic. I will continue to update this blog post as I keep making changes, learn more and have more to share.
Why Suricata (or Snort) Matters!
Running Suricata inline on my fail-over WAN2 catches common bad traffic in the act by actively inspecting and blocking malicious packets before they hit my internal network. This inline IPS deployment allows Suricata to inspect network traffic in real time, using its multithreaded architecture to handle high volumes without becoming a bottleneck.
On my VLAN3 (IoT devices and guest Wi-Fi) I run Suricata in alert-only IDS mode, which gives me visibility into network activity and potential threats without disrupting devices that may be sensitive to blocking actions. This staged approach allows me to tune and manage Suricata’s Signature IDs (SIDs) to filter out false positives and make sure legitimate traffic isn’t blocked. Of course, VLAN3 as mentioned earlier, is isolated—blocked from accessing any of the other LANs (private networks).
Once I’m confident the ruleset is properly filtered, I can enable full blocking in inline IPS mode and Suricata will automatically drop or reject malicious traffic without blocking valid traffic.
Suricata AND Snort, both being open source, having extensive protocol parsing and an active community, are flexible and powerful tools for network security, providing visibility and control over evolving threats.
Important notes about pfSense +Suricata + pfBlockerNG
Suricata on WAN interfaces duplicates pfSense’s “deny-all-unsolicited” policy, so enabling Suricata on WAN interfaces mostly burns CPU by parsing packets that will be dropped anyway. See added details on how and when to run Suricata IDS/IPS on WAN, in the discussion section at the end of this article.
pfBlockerNG on WAN interfaces drops traffic before state creation based on feeds, reputation, and GeoIP, something the default rule-set does not do. That saves resources, shrinks logs, and reduces the chance a future port-forward or mis-rule accidentally exposes you to a known bad host.
VPN settings — OpenVPN

OpenVPN client (NordVPN)
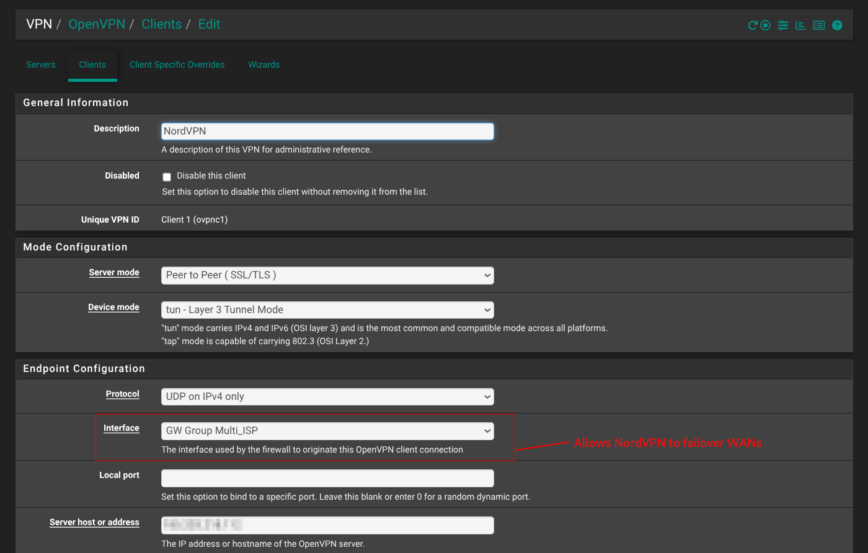
My only VPN entry is a site-to-Internet client that dials NordVPN. It connects to the Multi_ISP gateway, meaning when even WAN1 is down or experiencing packet loss, it will automatically reconnect to NordVPN using WAN2.
- Interface & transport It rides the Multi_ISP gateway group over UDP in a TUN device, so pfSense can fail over from fiber to cable without dropping the tunnel.
- TLS profile The client runs in p2p-tls mode with its CA/cert pair and full TLS-key-based server verification (
remote-cert-tls server). - Keep-alive
keepalive 10 60means pfSense sends a ping every ten seconds and restarts the session if nothing returns within a minute. - Route handling
route-no-exec yesblocks OpenVPN from touching the system routing table; instead, it steers traffic with policy-routing firewall rules, keeping default WAN traffic on your faster ISP.
Status menu
Having finished every menu that actually stores settings, the Status menu is where you simply view and monitor the firewall. Aside from a handful of log-rotation options and graph layouts, these pages contain mostly read-only information that lets you confirm if the tweaks you just made are working or identify any trouble.
Status menu cheat sheet
| pfSense Status menu | What you’ll look for | Typical use-case |
|---|---|---|
| Dashboard | Widgets: gateways, services, traffic, alerts | Quick “all-green?” glance |
| Gateways | dpinger latency / loss icons | Confirm or debug WAN fail-over |
| Interfaces | Link speed, errors, IP/MAC | Spot a NIC that dropped to 100 Mb/s |
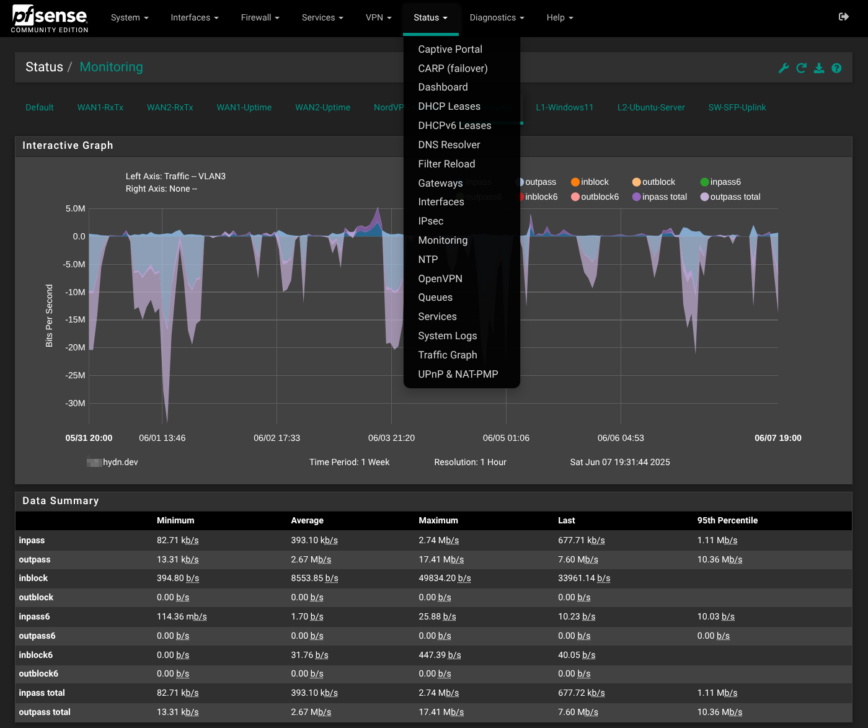
| Monitoring | RRD graphs: bandwidth, RTT, states | Compare week-long trends to an outage |
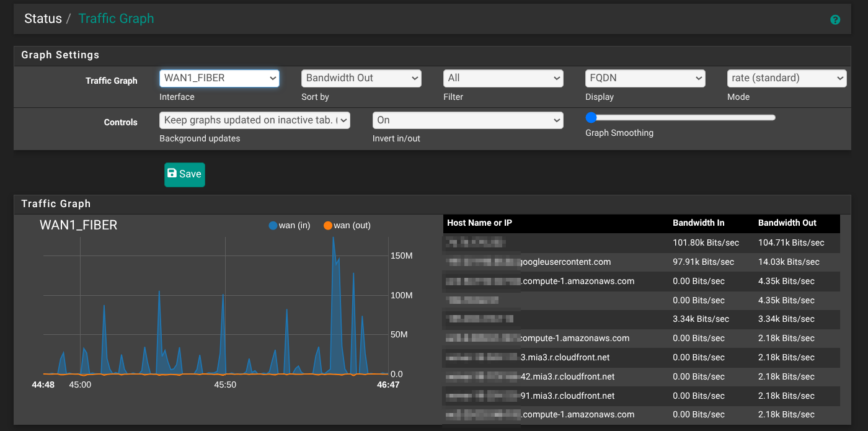
| Traffic Graph | 1-second live bps per interface | Monitor interface traffic in real-time |
| Services | Daemon up/down toggles | Restart Unbound without SSH |
| System Logs | Tail by tab: firewall, DHCP, etc. | Watch drops while testing a rule |
| DNS Resolver | Cache hits, forwarder status | Verify DoT is healthy |
| NTP | Peer offset & jitter | Ensure time sync for VPN/IPsec |
| OpenVPN | Client/server byte counters | Confirm NordVPN tunnel is up |
| IPsec | Phase-1/2 health | Check site-to-site tunnels (if used) |
| Queues | Traffic-shaper stats | See which class is hitting its cap |
| Captive Portal | Active sessions | Audit guest logins (if portal used) |
| CARP (failover) | VIP state: master/backup | Verify HA pair roles |
| DHCP Leases | IP ↔ MAC ↔ hostname list | Find what IP a device pulled |
| DHCPv6 Leases | IPv6 lease table | Same idea for v6 (if enabled) |
| UPnP & NAT-PMP | Current port mappings | Review or clear auto-opened ports |
Status > Traffic Graph
A one-minute, per-interface chart. Play around with it. Great to monitor real-time traffic on your interfaces.
Status > System Logs > Firewall > Summary View
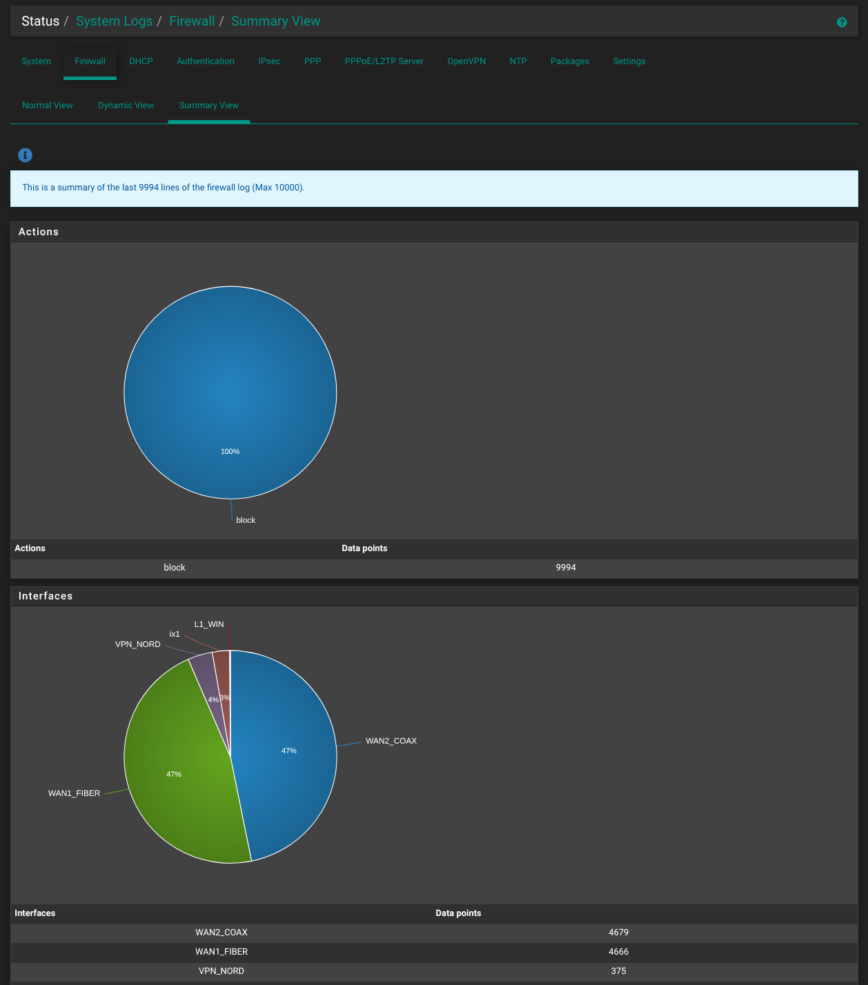
pfSense crunches the last 10,000 log entries into pie charts. The first shows the split between blocks, passes and rejects; the second breaks those actions down by interface. If I suddenly find 90% of blocks coming from WAN2 COAX, it’s a quick hint that the cable link is under scanning fire or a rule is mis-matching. Below this screenshot, it also breaks down events by protocols, IPs, and ports.
Status > Monitoring
RRD-backed line, bar, or area graphs for bandwidth, gateway quality, CPU load, and more. Tabs across the top (“WAN1-RxTx”, “VLAN-Guest”, “NordVPN-Uptime”) let you save custom views for instant access when you return. Pick Quality on the left axis to graph packet-loss and latency, or choose Traffic to watch seven-day throughput trends. Great for correlating a user’s “it was slow Tuesday night” report with an actual spike.
pfSense Diagnostics menu
The Diagnostics menu is your on-demand toolbox for low-level troubleshooting: everything from ARP tables to live pf state viewers, inline shell and file editors, packet captures, and quick network probes. Most entries simply scan the running system, while some more advanced options you can interact with the system as root, so use them carefully!
A couple of settings do persist, like forcing Syslog into reverse order, or grabbing backups preferences under Backup & Restore, but otherwise these pages let you verify runtime health, debug issues without SSH, and perform emergency tasks without rebooting.
Diagnostics menu cheat sheet
Below is a reference to the Diagnostics menu options, what each one does, and a few notes to keep in mind while using them:
| pfSense Diagnostics menu | What it’s for / does | Notes / gotchas |
|---|---|---|
| ARP Table | Show MAC ↔ IP neighbors on IPv4 networks | Clears on reboot; useful for spotting rogue hosts |
| Authentication | Test LDAP, RADIUS or local-user login | Great sanity-check |
| Backup & Restore | Download / upload config.xml and RRD data | Safest place to grab a manual backup |
| Command Prompt | Run shell or PHP commands in browser | Executes using root user |
| DNS Lookup | GUI wrapper for dig |
Perfect for verifying DoT / forwarder changes |
| Edit File | Inline editor for any file on disk | Put custom scripts in /conf to survive upgrades |
| Factory Defaults | Erase config and reboot to stock state | Nuke button—always back up first |
| Halt System | Graceful shutdown | Unmounts ZFS cleanly |
| Limiter Info | Display ALTQ/HFSC limiters | Empty when no traffic-shaper is configured |
| NDP Table | IPv6 neighbor cache (ARP for IPv6) | Empty if IPv6 is disabled or blocked |
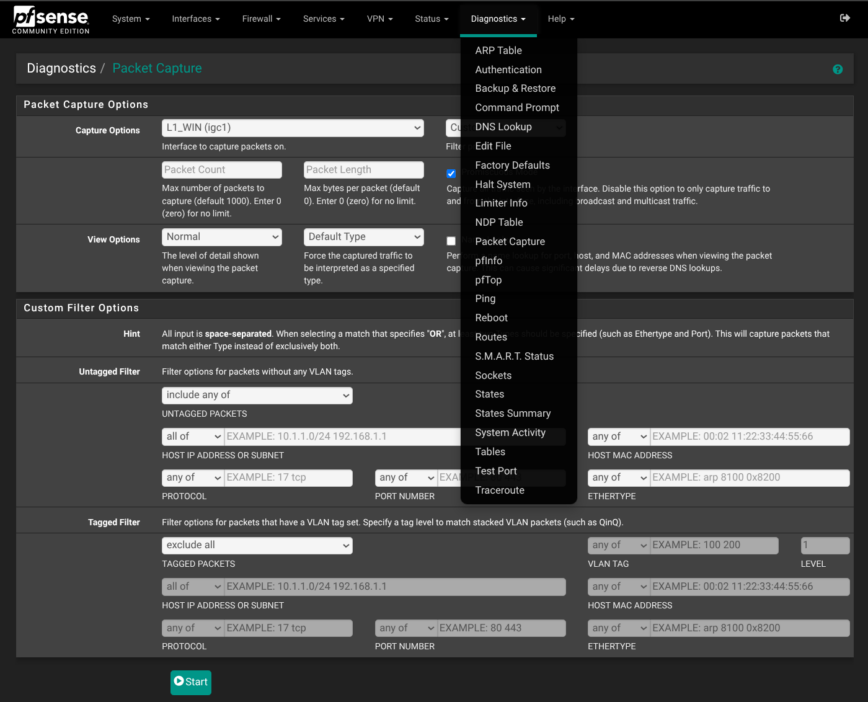
| Packet Capture | Browser front-end for tcpdump |
Stores capture in RAM until you download |
| pfInfo | Quick summary of loaded pf rules & counters | Great “is this rule matching?” sanity check |
| pfTop | Real-time state viewer (top-like) | Filter by interface, rule number, address, etc. |
| Ping | ICMP reachability test | Choose source-interface to test Multi-WAN paths |
| Reboot | Warm restart of firewall | Graceful—waits for services |
| Routes | Show routing table | Validate policy-routing or static routes |
| S.M.A.R.T. Status | Drive health (smartctl) |
Visible only if smartmontools is installed |
| Sockets | List open TCP/UDP sockets (sockstat) |
Filter by PID when hunting suspicious listeners |
| States | Live list of all pf states | Search by IP to debug NAT / asymmetric flows |
| States Summary | Counts of states per rule / interface | Quick view of which rule is hottest |
| System Activity | CPU / RAM viewer (top -SHaz) |
Toggle threads to spot runaway PHP workers |
| Tables | View / flush individual pf tables | Essential for pfBlockerNG testing |
| Test Port | TCP connect test to remote host:port | Great for quick “is this service reachable?” checks |
| Traceroute | Hop-by-hop path discovery | Source-interface option mirrors Ping/Test Port |
Bringing it all together with the Dashboard!
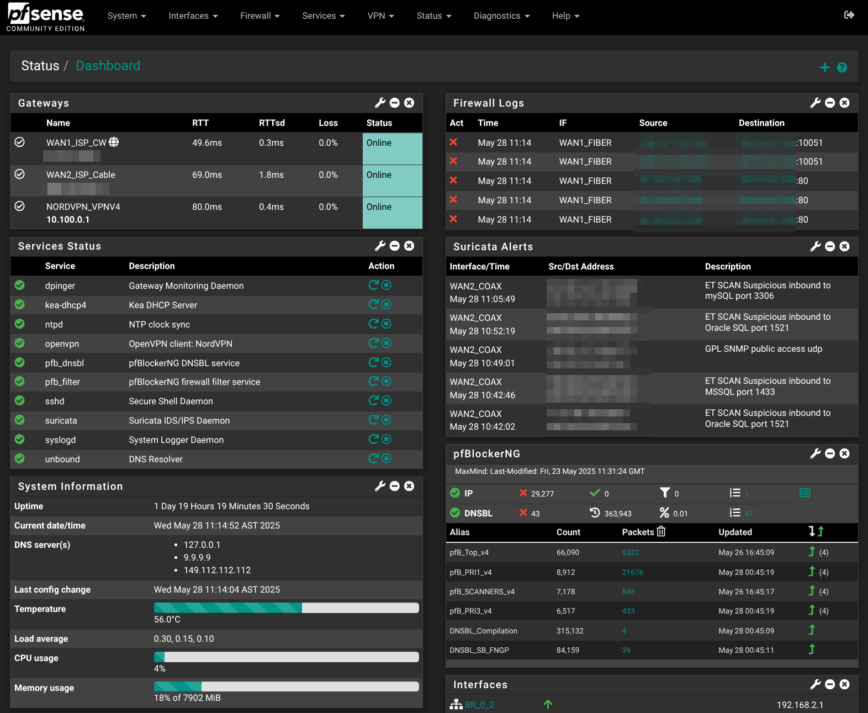
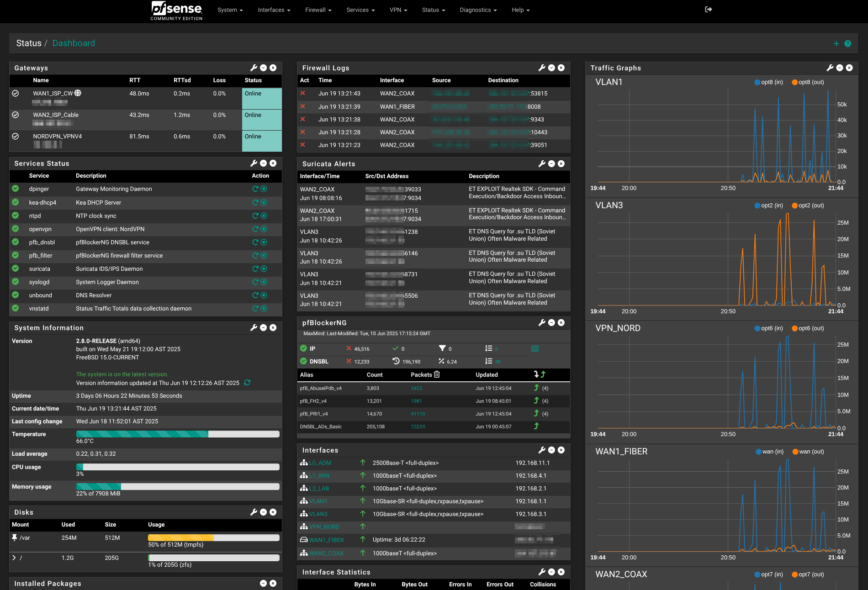
Now that everything has been configured, the last step is to arrange the Dashboard so a single glance answers the daily “is it healthy?” question. The screenshot above shows my layout, stacked left-to-right, top-to-bottom:
- Gateways sits at the very top-left, so WAN latency or a fail-over event jumps out immediately.
- Just below, Services Status turns red the moment Unbound, Suricata, pfBlockerNG, or OpenVPN stumbles.
- System Information I unchecked some options and kept version, uptime, DNS servers, temperature, system load average, CPU, and memory usage.
- Below that is Disks. It’s a lot more space than needed, but it was an NVMe I had sitting around since 2022. You can easily run pfSense for years on just 8 GB — 16 GB USB stick! These 128 GB NVMe’s, however, are cheap and fast!
- The center column starts with the rolling Firewall Logs, followed by Suricata Alerts and the pfBlockerNG widget—three panes that surface security events without diving into log files.
- Under those are Interfaces status, Interface Statistics and OpenVPN Client Interface Statistics (have to scroll).
- Lastly, the right column is all traffic: four live Traffic Graph widgets (Guest VLAN, VPN tunnel, Fiber WAN, Cable WAN) refresh every second, so bandwidth spikes are obvious.
That order matches how I triage problems: WAN up? → services up? → any blocks or alerts? → bandwidth normal? With the dashboard tuned this way, you land on pfSense, skim, and move on—no extra clicks needed.
Conclusion
With that, your pfSense box is no longer a blank slate but a finely tuned gateway: hardened at the edges, segmented into clear security zones, armed with curated threat feeds, and topped off with real-time visibility and off-site backups.
What we’ve built here is a platform we can use to learn our network traffic and, over time, improve performance, reliability, and security. A network you can continue to refine as your needs change or new packages emerge.
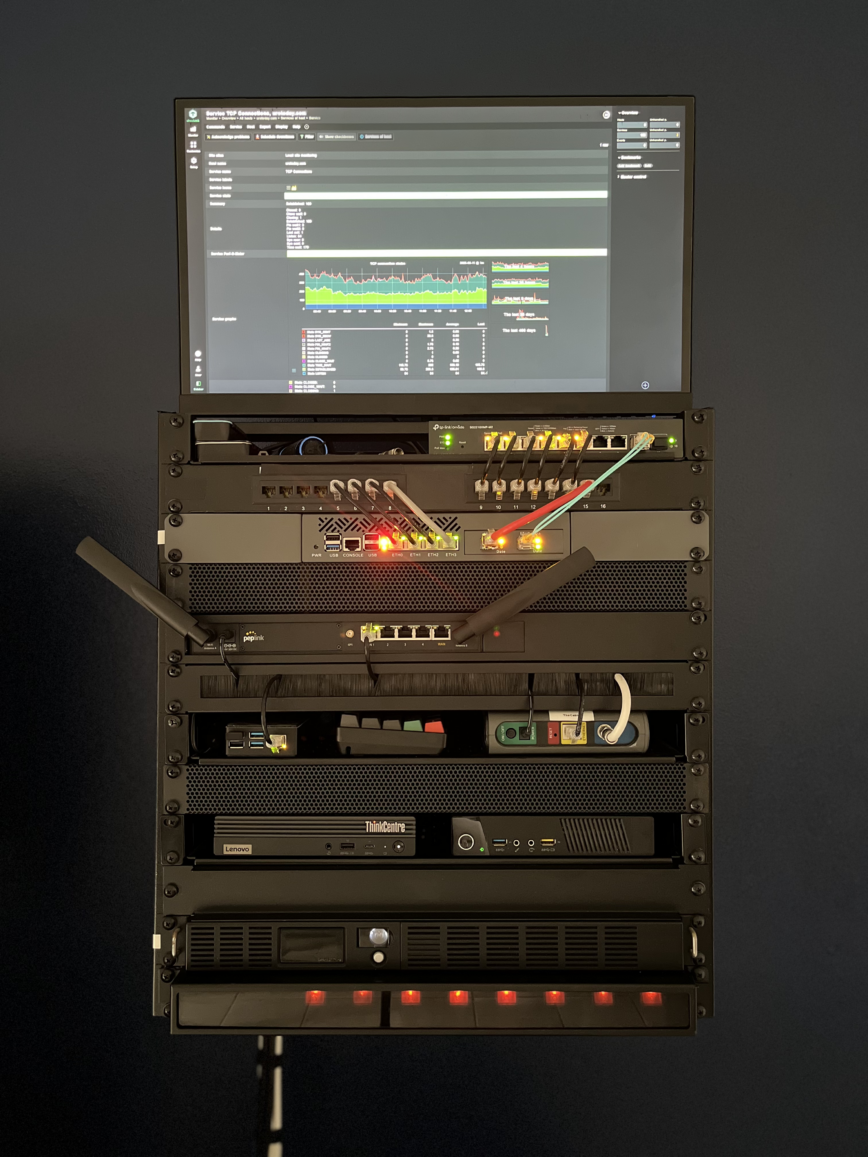
My 12u homelab rack as of June 2025
In this article, I tried to share tweaks, tips, and pitfalls from my own first few weeks with pfSense.
Next, I will be trying OPNsense, which is a fork of pfSense. I started with pfSense because something about the UI felt more familiar as I did my original research However, as a Linux sysadmin I generally prefer to be using Linux based systems.
So for now, here’s to stable ISPs, encrypted tunnels, and many trouble-free hours behind a pfSense firewall that we will continue to understand increasingly with time.
Changelog
List of recent updates and changes to this article (added to the comments section below, unless noted otherwise).
— June 13th 2025: added “Diagnostics > Packet Capture”.
— June 16th 2025: added “Keeping Suricata lean on a lightly used secondary WAN”.
— June 18th 2025: added a new pfSense package called Status Traffic Totals.
This article is a work in progress and will continue to receive ongoing updates and improvements. It’s essentially a collection of notes being assembled. I hope it’s useful to those interested in getting the most out of pfSense.
pfSense has been pure joy learning and configuring for the for past 2 months. It’s protecting all my Linux stuff, and FreeBSD is a close neighbor to Linux.
I plan on comparing OPNsense next. Stay tuned!
Update: June 13th 2025
Diagnostics > Packet Capture
I kept running into a problem where the NordVPN app on my phone refused to connect whenever I was on VLAN 1, the main Wi-Fi SSID/network. Auto-connect spun forever, and a manual tap on Connect did the same.
Rather than guess which rule was guilty or missing, I turned to Diagnostics > Packet Capture in pfSense.
1 — Set up a focused capture
Set the following:
192.168.1.105(my iPhone’s IP address)2 — Stop after 5-10 seconds
That short window is enough to grab the initial handshake. Hit Stop and view or download the capture.
3 — Spot the blocked flow
Opening the file in Wireshark or in this case just scrolling through the plain-text dump showed repeats like:
UDP 51820 is NordLynx/WireGuard’s default port. Every packet was leaving, none were returning. A clear sign the firewall was dropping them.
4 — Create an allow rule
On VLAN 1 I added one outbound pass rule:
The moment the rule went live, NordVPN connected instantly.
Packet Capture is often treated as a heavy-weight troubleshooting tool, but it’s perfect for quick wins like this: isolate one device, capture a short burst, and let the traffic itself tell you which port or host is being blocked.
Update: June 15th 2025
Keeping Suricata lean on a lightly-used secondary WAN
When you bind Suricata to a WAN that only has one or two forwarded ports, loading the full rule corpus is overkill. All unsolicited traffic is already dropped by pfSense’s default WAN policy (and pfBlockerNG also does a sweep at the IP layer), so Suricata’s job is simply to watch the flows you intentionally allow.
That means you enable only the categories that can realistically match those ports, and nothing else.
Here’s what that looks like on my backup interface (
WAN2):The ticked boxes in the screenshot boil down to two small groups:
app-layer-events,decoder-events,http-events,http2-events, andstream-events. These Suricata needs to parse HTTP/S traffic cleanly.emerging-botcc.portgrouped,emerging-botcc,emerging-current_events,emerging-exploit,emerging-exploit_kit,emerging-info,emerging-ja3,emerging-malware,emerging-misc,emerging-threatview_CS_c2,emerging-web_server, andemerging-web_specific_apps.Everything else—mail, VoIP, SCADA, games, shell-code heuristics, and the heavier protocol families, stays unchecked.
The result is a ruleset that compiles in seconds, uses a fraction of the RAM, and only fires when something interesting reaches the ports I’ve purposefully exposed (but restricted by alias list of IPs).
That’s this keeps the fail-over WAN monitoring useful without drowning in alerts or wasting CPU by overlapping with pfSense default blocks.
Update: June 18th 2025
I added a new pfSense package called Status Traffic Totals:
Update: October 7th 2025
Upgraded to pfSense 2.8.1:
Fantastic article @hydn !
Over the years, the RFC 1918 (private addressing) egress configuration had me confused. I think part of the problem is that my ISP likes to send me a modem one year and a combo modem/router the next year…making this setting interesting.
I see that Netgate has finally published a good explanation and guidance for RFC 1918 egress filtering:
I did not notice that addition, thanks for sharing!