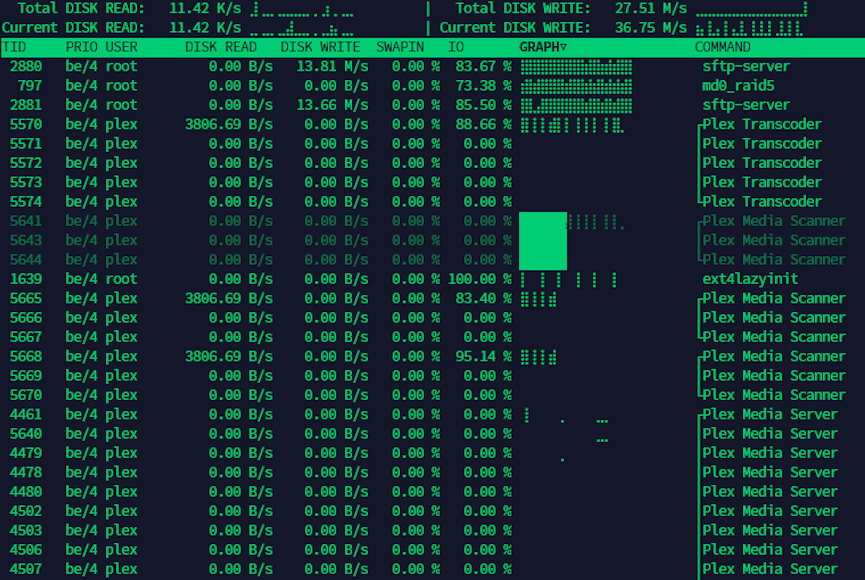
iotop command in Linux w/ examples.
This iotop command guide follows my previous 90 Linux Commands frequently used by Linux Sysadmins article. As time allows, I will continue to publish articles on the 90+ commands geared toward Linux sysadmins and Linux power users. Let’s continue this series with the iotop command.
iotop is a simple top-like I/O monitor. A terminal program that pinpoints processes that use a high amount of IO (input/output) requests on your machine. With a similar layout to the top command-line tool, iotop lists current I/O usage by processes or threads.
 Linux server performance: Is disk IO slowing your application?
Often, one of the possible causes of a slow Linux system is high IO – aka blocking, IO bottleneck, wait time or waiting time – which means that some processes that need IO have to wait because the IO throughput capacity has already been exceeded and cannot immediately serve any additional requests.
iotop Linux install
Usually, a monitoring tool used on a system under heavy stress should use the least additional resources possible. Therefore, my preference is to install iotop-c. iotop-c is an alternative re-implementation of iotop in C, optimized for performance.
Here’s how to install ‘iotop-c‘ (use ‘iotop‘ for the original iotop utility):
Debian, Ubuntu and other derivatives
Use the following command:
apt install iotop-c
CentOS, RHEL and Fedora
Use the following commands (or replace’dnf‘with’yum‘for older releases):
dnf install epel-release
dnf install iotop-c
Arch/Manjaro/other derivatives
pacman -S iotop-c
iotop command examples
Here are a few useful command-line examples for using the iotop/iotop-c utility.
To start iotop I/O monitor, use:
iotop-c
To show only processes or threads actually doing I/O, use:
iotop-c -o
To show I/O usage in non-interactive mode, use:
iotop-c -b
To show only I/O usage of processes (default is to show all threads), use:
iotop-c -P
To show I/O usage of given PID(s), use:
iotop-c -p PID
To show I/O usage of a given user, use:
iotop-c -u user
To show accumulated I/O instead of bandwidth, use:
iotop-c -a
To analyze the performance of a single program (PID) and log the results to a file, use:
iotop -bp PID > iostats.log
To only show processes or threads that are actually doing I/O + only show processes, not all threads + show the accumulated I/O instead of bandwidth, use:
iotop-c -oPa
iotop Parameters and Descriptions:
–version – Show the program’s version number and exit.
-h, –help – Show this help message and exit.
-o, –only – Only show processes or threads that are actually doing I/O.
-b, –batch – Non-interactive mode.
-n NUM, –iter=NUM – The number of iterations before ending (default = infinite).
-d SEC, –delay=SEC – The delay between iterations, in seconds (default = 1).
-p PID, –pid=PID – The processes/threads to monitor (default = all).
-u USER, –user=USER – The users to monitor (default = all).
-P, –processes – Only show processes, not all threads.
-a, –accumulated – Show the accumulated I/O instead of bandwidth.
-k, –kilobytes – Use kilobytes instead of a human-friendly unit.
-t, –time – Add a timestamp on each line (implies –batch).
-c, –fullcmdline – Show full command line
-1, –hide-pid – hide PID/TID column
-2, –hide-prio – hide PRIO column
-3, –hide-user – hide USER column
-4, –hide-read – hide DISK READ column
-5, –hide-write – hide DISK WRITE column
-6, –hide-swapin – hide SWAPIN column
-7, –hide-io – hide IO column
-8, –hide-graph – hide GRAPH column
-9, –hide-command – hide COMMAND column
-H, –no-help – suppress listing of shortcuts
-q, –quiet – Suppress some lines of header (implies –batch).
iotop Keyboard Shortcuts
q, Q – Exit
<space>, r, R – Toggle sort order
<home> – Scroll to the top of the list
<end> – Scroll to the bottom of the list
<page-up> – Scroll one screen up
<page-down> – Scroll one screen down
<up> – Scroll one line up
<down> – Scroll one line down
<right> – Sort by next column
<left> – Sort by previous column
<esc> – Cancel ionice or filter selection. In case only the help window is open, then close it
o, O – Toggle showing only processes with IO activity
p, P – Toggle showing processes/threads
a, A – Toggle showing accumulated/current values
?, h, H – Toggle showing shortcut help
c, C – Toggle showing full command line
1, 2, 3, 4, 5, 6, 7, 8, 9 – Toggle showing the column (column number corresponds to the shortcut)
0 – Show all columns
i, I – IOnice a process/thread (depends on process/thread display mode)
f, F – Change UID and PID filters
u, U – Toggle using Unicode/ASCII characters for pseudo graph
x, X – Toggle the display mode of exited processes/threads between letter x and inverse background
s, S – Toggle freeze of data collection
Ctrl-T – Toggle task_delayacct kernel sysctl.
Useful links/references:
- iotop-c github.
- What is iowait and how does it affect Linux performance?
- Debugging disk I/O on Linux servers.
- Linux server performance: Is disk IO slowing your application?
Related commands:
- vmstat – shows system memory, processes, interrupts, paging, block I/O, and CPU info.
- top – shows an overall system view.
- atop – For Linux server performance analysis.
- htop – interactive process viewer and manager.