iostat command in Linux with examples
This article is a follow-up to the previous 90 Linux Commands frequently used by Linux Sysadmins post. Every week, as time allows, I will publish articles on the 90 commands geared toward Linux sysadmins and Linux power users.
iostat command in Linux and other Unix-like systems.

IOstat is a powerful Linux tool that provides detailed insights into your system’s input/output (I/O) performance. This tool is ideal for system administrators who want to optimize their system performance by monitoring disk and network I/O usage. In this article, we’ll explore IOstat, and its features and provide some example commands.
The iostat command is part of the sysstat package, which is installed on most Linux distributions. To use iostat, open a terminal and type iostat followed by the desired flags.
The iostat command provides a wealth of information, including:
- CPU utilization
- Disk throughput (reads and writes)
- Disk utilization (percentage of time the disk is busy)
- Average wait time (the time spent waiting for I/O operations to complete)
- Number of I/O operations per second (reads and writes)
- Network I/O statistics (if using the
-nflag)
The basic syntax for iostat is as follows:
iostat [OPTIONS] [DEVICE] [INTERVAL][COUNT]<code">
Here are some of the most useful flags:
- -d : Display disk I/O statistics
- -k : Display statistics in kilobytes
- -m : Display statistics in megabytes
- -p : Display statistics for individual partitions
- -t : Display the timestamp for each report
Example 1: Display disk I/O statistics for all devices
iostat -d
Example 2: Display disk I/O statistics for a specific device (in this case, /dev/sda)
iostat -d /dev/sda
Example 3: Display disk I/O statistics for a specific partition (in this case, /dev/sda1)
iostat -p /dev/sda1
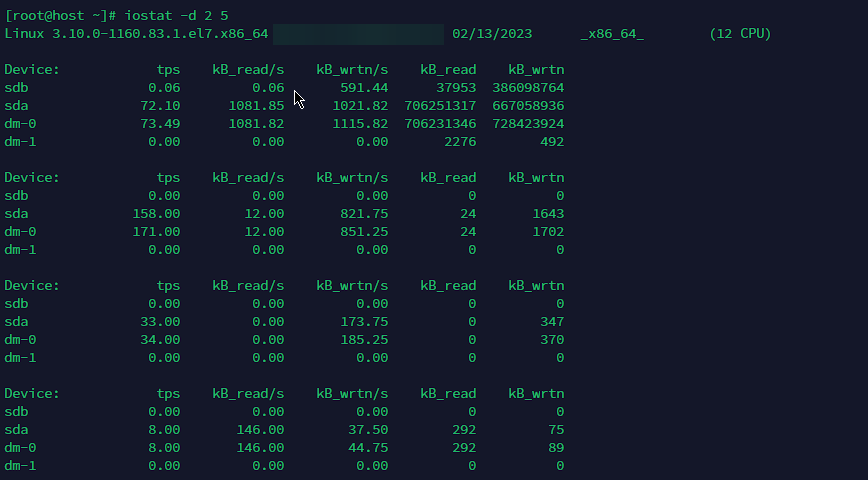
Example 4: Display disk I/O statistics at a regular interval of 2 seconds, for a total of 5 times
iostat -d 2 5
By monitoring your system’s I/O performance with iostat, you can identify potential bottlenecks and optimize your system to improve performance.
Related commands:
- vmstat: provides information about system memory, virtual memory, and CPU usage.
- sar: collects, reports, and saves system activity information, including CPU, memory, disk, and network usage.
- top: displays real-time information about system processes and resource usage, including CPU and memory usage.
- mpstat: reports per-processor statistics, including CPU utilization, interrupt rates, and CPU frequency.
Useful links/reference:
Conclusion
Iostat is a valuable tool for Linux system administrators. With the right flags, you can gain detailed insights into your system’s I/O performance and optimize your system for better performance. Give it a try and see how iostat can help you monitor and improve your system’s performance.
Seems like a very good command to know, but what scenarios would I need to use this in?
Is it just for determining if a drive is performing well or are there other reasons to know this information?
Hi @MadMatt, a good reason to use iostat would be to monitor and troubleshoot disk I/O performance. For example this article: Linux server performance: Is disk I/O slowing your application?
You don’t need to use any flags. In fact you get comprehensive output including kernel and CPU information if you just use
iostatby itself.Where do the stats come from? What is doing the tracking?
The
iostatstats come from the Linux kernel, specifically the/proc/diskstatsfile. The kernel tracks I/O operations, including reads, writes, and time spent on I/O.iostatreads this data, processes it, and presents the I/O statistics in a user-friendly format.This is pretty standard and expected though, most system monitoring tools like
top,htop, and others also pull data from the Linux kernel, primarily through the/proc* filesystem. They access files like/proc/stat,/proc/meminfo, and/proc/loadavg, which the kernel continuously updates with system performance metrics.Yes indeed!