How to diagnose OOM errors on Linux systems
Out-of-memory (OOM) errors take place when the Linux kernel can’t provide enough memory to run all of its user-space processes, causing at least one process to exit without warning. Without a comprehensive monitoring solution, OOM errors can be tricky to diagnose.
In this post, you will learn how to diagnose OOM errors in Linux kernels by:
- Analyzing different types of OOM error logs
- Choosing the most revealing metrics to explain low-memory situations on your hosts
- Using a profiler to understand memory-heavy processes
- Setting up automated alerts to troubleshoot OOM error messages more easily
Identify the error message
OOM error logs are normally available in your host’s syslog (in the file /var/log/syslog). In a dynamic environment with a large number of ephemeral hosts, it’s not realistic to comb through system logs manually—you should forward your logs to a monitoring platform for search and analysis. This way, you can configure your monitoring platform to parse these logs so you can query them and set automated alerts. Your monitoring platform should enrich your logs with metadata, including the host and application that produced them, so you can localize issues for further troubleshooting.
There are two major types of OOM error, and you should be prepared to identify each of these when diagnosing OOM issues:
- Error messages from user-space processes that handle OOM errors themselves
- Error messages from the kernel-space OOM Killer
Error messages from user-space processes
User-space processes receive access to system memory by making requests to the kernel, which returns a set of memory addresses (virtual memory) that the kernel will later assign to pages in physical RAM. When a user-space process first requests a virtual memory mapping, the kernel usually grants the request regardless of how many free pages are available. The kernel only allocates free pages to that mapping when it attempts to access memory with no corresponding page in RAM.
When an application fails to obtain a virtual memory mapping from the kernel, it will often handle the OOM error itself, emit a log message, then exit. If you know that certain hosts will be dedicated to memory-intensive processes, you should determine in advance what OOM logs these processes output, then set up alerts on these logs. Consider running game days to see what logs your system generates when it runs out of memory, and consult the documentation or source of your critical applications to ensure that your log management system can ingest and parse OOM logs.
The information you can obtain from error logs differs by application. For example, if a Go program attempts to request more memory than is available on the system, it will print a log that resembles the following, print a stack trace, then exit.
fatal error: runtime: out of memory
In this case, the log prints a detailed stack trace for each goroutine running at the time of the error, enabling you to figure out what the process was attempting to do before exiting. In this stack trace, we can see that our demo application was requesting memory while calling the *ImageProcessor.IdentifyImage() method.
goroutine 1 [running]:
runtime.systemstack_switch()
/usr/local/go/src/runtime/asm_amd64.s:330 fp=0xc0000b9d10 sp=0xc0000b9d08 pc=0x461570
runtime.mallocgc(0x278f3774, 0x695400, 0x1, 0xc00007e070)
/usr/local/go/src/runtime/malloc.go:1046 +0x895 fp=0xc0000b9db0 sp=0xc0000b9d10 pc=0x40c575
runtime.makeslice(0x695400, 0x278f3774, 0x278f3774, 0x38)
/usr/local/go/src/runtime/slice.go:49 +0x6c fp=0xc0000b9de0 sp=0xc0000b9db0 pc=0x44a9ec
demo_app/imageproc.(*ImageProcessor).IdentifyImage(0xc00000c320, 0x278f3774, 0xc0278f3774)
demo_app/imageproc/imageproc.go:36 +0xb5 fp=0xc0000b9e38 sp=0xc0000b9de0 pc=0x5163f5
demo_app/imageproc.(*ImageProcessor).IdentifyImage-fm(0x278f3774, 0x36710769)
demo_app/imageproc/imageproc.go:34 +0x34 fp=0xc0000b9e60 sp=0xc0000b9e38 pc=0x5168b4
demo_app/imageproc.(*ImageProcessor).Activate(0xc00000c320, 0x36710769, 0xc000064f68, 0x1)
demo_app/imageproc/imageproc.go:88 +0x169 fp=0xc0000b9ee8 sp=0xc0000b9e60 pc=0x516779
main.main()
demo_app/main.go:39 +0x270 fp=0xc0000b9f88 sp=0xc0000b9ee8 pc=0x66cd50
runtime.main()
/usr/local/go/src/runtime/proc.go:203 +0x212 fp=0xc0000b9fe0 sp=0xc0000b9f88 pc=0x435e72
runtime.goexit()
/usr/local/go/src/runtime/asm_amd64.s:1373 +0x1 fp=0xc0000b9fe8 sp=0xc0000b9fe0 pc=0x463501
Since this behavior is baked into the Go runtime, Go-based infrastructure tools like Consul and Docker will output similar messages in low-memory conditions.
In addition to error messages from user-space processes, you’ll want to watch for OOM messages produced by the Linux kernel’s OOM Killer.
Error messages from the OOM Killer
If a Linux machine is seriously low on memory, the kernel invokes the OOM Killer to terminate a process. As with user-space OOM error logs, you should treat OOM Killer logs as indications of overall memory saturation.
How the OOM Killer works
To understand when the kernel produces OOM errors, it helps to know how the OOM Killer works. The OOM Killer terminates a process using heuristics. It assigns each process on your system an OOM score between 0 and 1000, based on its memory consumption as well as a user-configurable adjustment score. It then terminates the process with the highest score. This means that, by default, the OOM Killer may end up killing processes you don’t expect. (You will see different behavior if you configure the kernel to panic on OOM without invoking the OOM Killer, or to always kill the task that invoked the OOM Killer instead of assigning OOM scores.)
The kernel invokes the OOM Killer when it tries—but fails—to allocate free pages. When the kernel fails to retrieve a page from any memory zone in the system, it attempts to obtain free pages by other means, including memory compaction, direct reclaim, and searching again for free pages in case the OOM Killer had terminated a process during the initial search. If no free pages are available, the kernel triggers the OOM Killer. In other words, the kernel does not “see” that there are too few pages to satisfy a memory mapping until it is too late.
OOM Killer logs
You can use the OOM Killer logs both to identify which hosts in your system have run out of memory and to get detailed information on how much memory different processes were using at the time of the error. You can find an annotated example in the git commit that added this logging information to the Linux kernel. For example, the OOM Killer logs provide data on the system’s memory conditions at the time of the error.
Mem-Info:
active_anon:895388 inactive_anon:43 isolated_anon:0
active_file:13 inactive_file:9 isolated_file:1
unevictable:0 dirty:0 writeback:0 unstable:0
slab_reclaimable:4352 slab_unreclaimable:7352
mapped:4 shmem:226 pagetables:3101 bounce:0
free:21196 free_pcp:150 free_cma:0
As you can see, the system had 21,196 pages of free memory when it threw the OOM error. With each page on the system holding up to 4 kB of memory, we can assume that the kernel needed to allocate at least 84.784 MB of physical memory to meet the requirements of currently running processes.
Understand the problem
If your monitoring platform has applied the appropriate metadata to your logs, you should be able to tell from a wave of OOM error messages which hosts are facing critically low memory conditions. The next step is to understand how frequently your hosts reach these conditions—and when memory utilization has spiked anomalously—by monitoring system memory metrics. In this section, we’ll review some key memory metrics and how to get more context around OOM errors.
Choose the right metrics
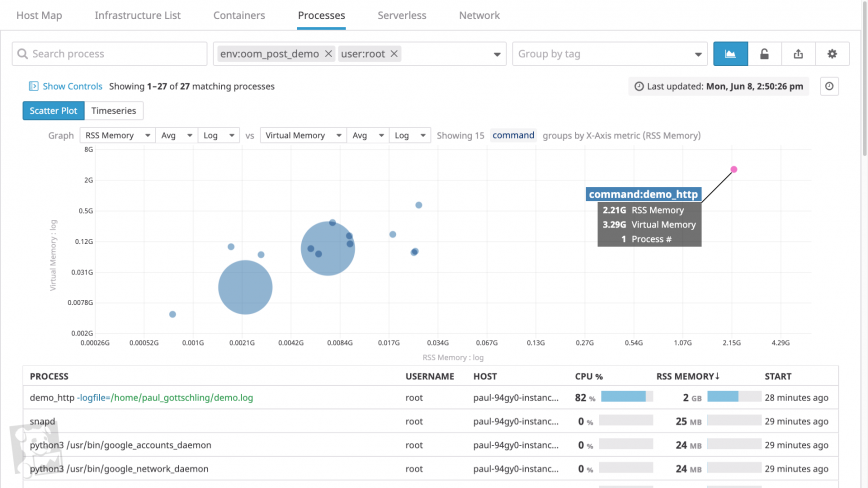
As we’ve seen, it’s difficult for the Linux kernel to determine when low-memory conditions will produce OOM errors. To make matters worse, the kernel is notoriously imprecise at measuring its own memory utilization, as a process can be allocated virtual memory but not actually use the physical RAM that those addresses map to. Since absolute measures of memory utilization can be unreliable, you should use another approach: determine what levels of memory utilization correlate with OOM errors in your hosts and what levels indicate a healthy baseline (e.g. by running game days).
When monitoring overall memory utilization in relation to a healthy baseline, you should track both how much virtual memory the kernel has mapped for your processes and how much physical memory your processes are using (called the resident set size). If you’ve configured your system to use a significant amount of swap space—space on disk where the kernel stores inactive pages—you can also track this in order to monitor total memory utilization across your system.
Determine the scope
Your monitoring platform should tag your memory metrics with useful metadata about where those metrics came from—or at least the name of the associated host and process. The host tag is useful for determining if any one host is consuming an unusual amount of memory, whether in comparison to other hosts or to its baseline memory consumption.
You should also be able to group and filter your timeseries data either by process within a single host, or across all hosts in a cluster. This will help you determine whether any one process is using an unusual amount of memory. You’ll want to know which processes are running on each system and how long they’ve been running—in short, how recently your system has demanded an unsustainable amount of memory.
Find aggravating factors
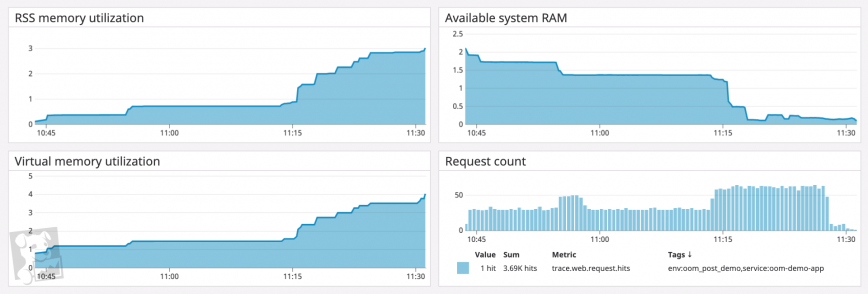
If certain processes seem unusually memory-intensive, you’ll want to investigate them further by tracking metrics for other parts of your system that may be contributing to the issue.
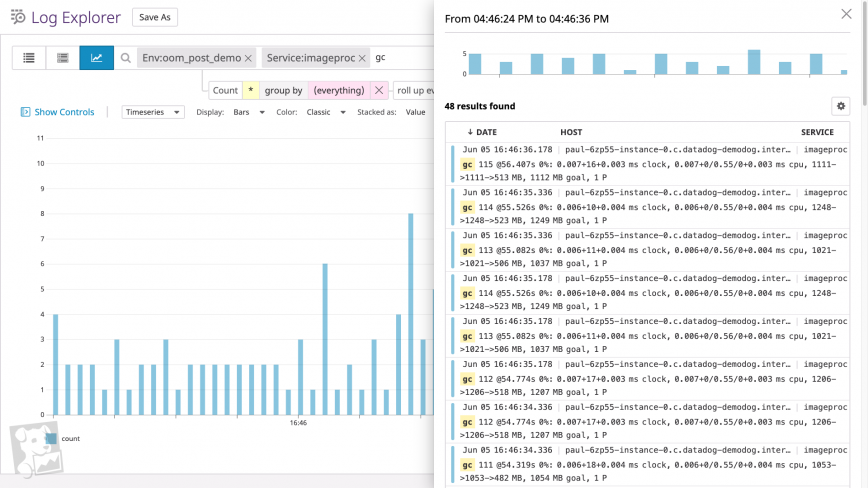
For processes with garbage-collected runtimes, you can investigate garbage collection as one source of higher-than-usual memory utilization. On a timeseries graph of heap memory utilization for a single process, garbage collection forms a sawtooth pattern (e.g. the JVM)—if the sawtooth does not return to a steady baseline, you likely have a memory leak. To see if your process’s runtime is garbage collecting as expected, graph the count of garbage collection events alongside heap memory usage.
Alternatively, you can search your logs for messages accompanying the “cliffs” of the sawtooth pattern. If you run a Go program with the GODEBUG environment variable assigned to gctrace=1, for example, the Go runtime will output a log every time it runs a garbage collection. (The screenshot below shows a graph of garbage collection log frequency over time, plus a typical list of garbage collection logs.)
Another factor has to do with the work that a process is performing. If an application is managing memory in a healthy way (i.e. without memory leaks) but still using more than expected, the application may be handling unusual levels of work. You’ll want to graph work metrics for memory-heavy applications, such as request rates for a web application, query throughput for a database, and so on.
Find unnecessary allocations
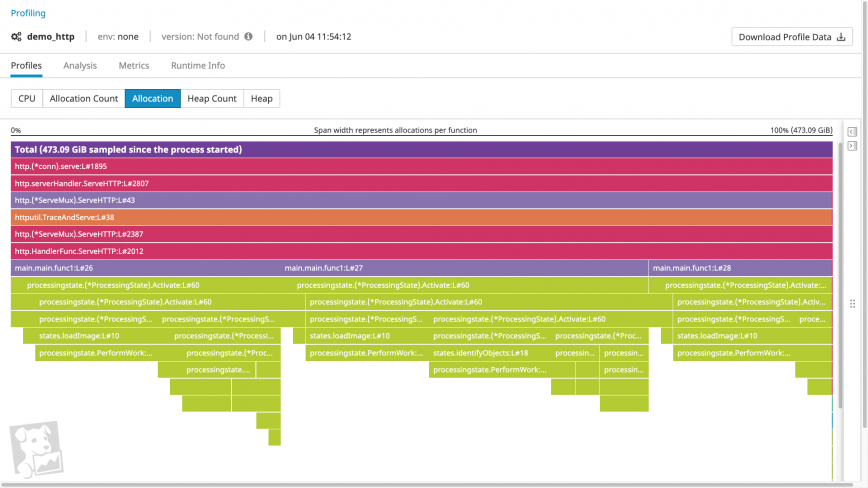
If a process doesn’t seem to be subject to any aggravating factors, it’s likely that the process is requesting more memory than you anticipate. One tool that helps you identify these memory requests is a memory profile.
Memory profiles visualize both the order of function calls within a call stack and how much heap memory each function call allocates. Using a memory profiler, you can quickly determine whether a given call is particularly memory intensive. And by examining the call’s parents and children, you can determine why a heavy allocation is taking place. For example, a profile could include a memory-intensive code path introduced by a recent feature release, suggesting that you should optimize the new code for memory utilization.
Get notified on OOM errors
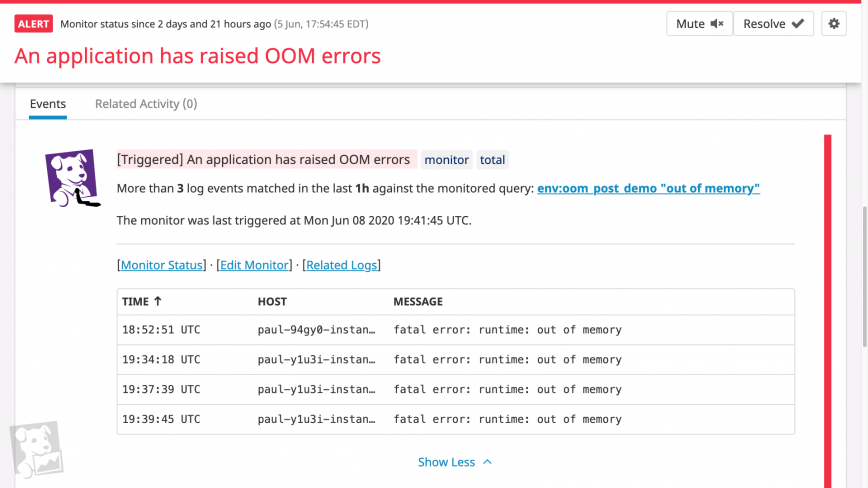
The most direct way to find out about OOM errors is to set alerts on OOM log messages: whenever your system detects a certain number of OOM errors in a particular interval, your monitoring platform can alert your team. But to prevent OOM errors from impacting your system, you’ll want to be notified before OOM errors begin to terminate processes. Here again, knowing the healthy baseline usage of virtual memory and RSS utilization allows you to set alerts when memory utilization approaches unhealthy levels. Ideally, you should be using a monitoring platform that can forecast resource usage and alert your team based on expected trends, and flag anomalies in system metrics automatically.
Investigate OOM errors in a single platform
Since the Linux kernel provides an imprecise view of its own memory usage and relies on page allocation failures to raise OOM errors, you need to monitor a combination of OOM error logs, memory utilization metrics, and memory profiles.
A monitoring service like Datadog unifies all of these sources of data in a single platform, so you get comprehensive visibility into your system’s memory usage—whether at the level of the process or across every host in your environment. To stay on top of memory saturation issues, you can also set up alerts to automatically notify you about OOM logs or projected memory usage. By getting notified when OOM errors are likely, you’ll know which parts of your system you need to investigate to prevent application downtime. If you’re curious about using Datadog to monitor your infrastructure and applications, sign up for a free trial.
About Datadog
Datadog is a SaaS-based monitoring and analytics platform for cloud-scale infrastructure, applications, logs, and more. Datadog delivers complete visibility into the performance of modern applications in one place through its fully unified platform. By reducing the number of tools needed to troubleshoot performance problems, Datadog reduces the time needed to detect and resolve issues. With vendor-backed integrations for 400+ technologies, a world-class enterprise customer base, and focus on ease of use, Datadog is the leading choice for infrastructure and software engineering teams looking to improve cross-team collaboration, accelerate development cycles, and reduce operational and development costs.
Published: June 23rd, 2020 | Last updated: December 15th, 2023