Analyze Your Website’s TTFB (Time to First Byte)
Have you improved the load time of your websites and web applications recently? Or, maybe your web store or other web app is now slower to respond as you’ve added more features or due to data growth? The time it takes for your web applications to respond when users visit is more important than ever before! After seeing the tangible benefits of reducing server response, network connection, and page load times of this blog, I can attest to this. Without going into specifics, a few of the benefits include longer time on site, increased engagement and more conversions, to name a few.
That said, as it pertains to the end-user performance of your web applications, where should you start? This will vary case by case. For example, let’s say your WebDev team did a clumsy job of optimizing your application’s performance. Thus, when you scan your page using tools such as GTmetrix, WebPageTest, etc. The results look something like this:

In this case, you have a lot more things to address before looking seriously into TTFB. However, if your frontend test results look closer to the screenshot below, most times, you can continue to improve page load times by reducing your TTFB.

Low TTFB can achieve this by optimizing and improving your network connection and back-end (server) response times. In brief, some of the factors that can cause slow TTFB are: DNS resolution, database, server-side scripting, server hardware, poorly configured server, lack of caching, web host network and upstream performance. To successfully troubleshoot and lower your TTFB, you may need professional help. For this article, we will be looking at analyzing TTFB.
Also, see 100+ Top Server Monitoring & Application Monitoring Tools.
What is TTFB?
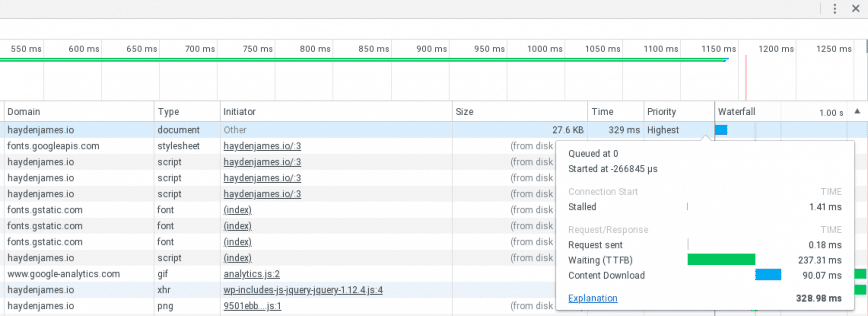
The time spent waiting for the initial “server response” is also known as the Time To First Byte (TTFB). This time captures the latency of a round trip to connect the client to the server, plus the time spent waiting for the server to deliver a response. (Source: developers.google.com) High TTFB is usually a sign of one or both of the following issues: 1) Poor network conditions between client and server or 2) Slow-to-respond web application/server.
High TTFB will often cause your page loads to be mysteriously slow or, at the very least, increase the latency between page loads. You should check to see if your TTFB is a performance issue or not. Try to keep TTFB under 200 milliseconds. 2nd+ requests should be even lower.
TTFB check using CURL
Here’s a quick example of using CURL to check TTFB from your Linux or Mac terminal app. Use the following command, replacing “https://linuxblog.io/” with your domain:
curl -o /dev/null -w "Connect: %{time_connect} TTFB: %{time_starttransfer} Total time: %{time_total} \n" https://linuxblog.io/
Example output:
  % Total    % Received % Xferd  Average Speed   Time    Time     Time  Current
                                 Dload  Upload   Total   Spent    Left  Speed
100 34782    0 34782    0     0   143k      0 --:--:-- --:--:-- --:--:--  144k
Connect: 0.018 TTFB: 0.231 Total time: 0.236
Additional TTFB check methods (using a web browser)

In addition, to curl, you can check TTFB using these tools.
- Google Chrome browser Inspect tool
- Gtmetrix.com
- Webpagetest.org – Website Performance and Optimization Test
- Performance.sucuri.net
- Tools.keycdn.com/performance
Related reading: Nginx tuning tips: TLS/SSL HTTPS – Improved TTFB/latency
Conclusion
Understanding and optimizing TTFB (Time To First Byte) is crucial for enhancing the performance of your web applications. It is the first step in reducing overall page load times, leading to improved user experience, engagement, and potentially more conversions.
Remember, a high TTFB not only affects the loading speed of your pages, but can also impact your site’s SEO and your user’s satisfaction. Whether you’re dealing with issues in network connectivity, server hardware, or back-end optimizations, addressing these can significantly lower your TTFB.
Using tools like curl, Google Chrome’s Inspect tool, GTmetrix, and others, you can effectively analyze and identify areas for improvement. So, keep a close eye on your TTFB metrics, and consider professional help.
Last updated: November 30th, 2023
TTFB for my websites used to be pretty poor.
I recently migrated my server to a provider with better network connectivity and implemented a CDN, this improved the TTFB a lot. I’d love to get the whole website fully HTML cached in Cloudflare as well.
So many people overlook this on their sites and wonder why their traffic is stagnant or even declines. When I was still running a blog, I had huge growth out the gate but it trickled over time and eventually was at 80% what it once was. Had I actually looked into the TTFB for it, I could have probably saved it. Too late now! Was a nice side earner for me for a few years at least.
Cloudflare can help immensely with TTFB, especially if your website doesn’t need to make calls to the database.
I have a static WordPress site served entirely by Cloudflare using their Workers feature. The TTFB and general speed are outstanding.
What are the biggest determining factors for TTFB?
My Joomla website isn’t as low as I would hope and I’m wondering how to fix it. Is it the web server or the content on the site? It’s currently running on Apache and the homepage is pretty heavy so I’m not sure where to begin.
Is there not a whole topic of PWAs (Progressive Web Apps), for which facilities are built into devtools, which bears some relationship to this topic?