VPS IOPS vs. Latency: Why NVMe Benchmarks Lie
Every VPS provider loves to advertise NVMe storage. It sounds fast on paper and is usually a noticeable upgrade over older disk (HDD) and traditional SSD storage. The problem is that those IOPS numbers on their own often tell you very little about how your server will feel under typical loads.
IOPS measures throughput: how many I/O operations per second a disk can sustain under parallel load.
Latency measures responsiveness: how quickly each individual operation completes.
Both metrics matter, but for typical web and database servers on a VPS, latency is more important to perceived performance. In real-world use at low queue depths, a lower-latency disk will make your applications feel faster than just sky-high IOPS.
This article is a follow-up to a series of articles focused on VPS performance and disk I/O, including Linux iowait behavior, misleading “idle” metrics, and why small VPS instances increasingly feel slow: What is Linux iowait? (Explained With Examples), Why Your Linux Server “Looks Idle” but “Feels” Slow, and Why Small VPSs Feel Slower Than They Used To.
With that context, let’s shift the focus to storage benchmarks and why IOPS numbers alone fail to explain real-world performance accurately.
Why Latency Matters Even More Than IOPS
Think about what actually happens on a typical VPS. A PHP script executes and waits for a database query. MySQL reads a few blocks from disk. Nginx writes to an access log. None of these operations occur in parallel; they’re sequential, single-threaded tasks that block the process until each is complete.
When VPS hosting providers advertise 100,000 IOPS, that number is almost always produced by synthetic benchmarks running at high queue depths (qd32+) with heavy parallelism, not by workloads that resemble typical VPS usage.
Your web application doesn’t operate that way. It usually runs at queue depth 1 or 2, waiting on each I/O to complete before moving to the next. At qd1, what matters isn’t how many operations the disk can juggle in parallel, but how fast each individual operation finishes.
The Benchmark
I ran identical fio benchmarks on three VPS instances from different providers. All advertise NVMe storage. The tests used 4K random read/write at low queue depths; the conditions that mirror actual server workloads.
The metric to watch is p99.9 latency (99.9th percentile): the worst 0.1% of operations. Average latency hides problems. p99.9 exposes them. Those slow outliers are what make your site feel sluggish and cause requests to pile up.
Why the IOPS Numbers Lie
Here’s the IOPS comparison for realistic VPS workloads:
| IOPS Test | Provider A Read |
Provider B Read |
Provider C Read |
Provider A Write |
Provider B Write |
Provider C Write |
|---|---|---|---|---|---|---|
| 4k_qd1_jobs1 (70/30) | 5,976 | 9,013(+50.8%) | 13,883(+132.3%) | 2,547 | 3,882(+52.4%) | 5,976(+134.6%) |
| 4k_qd1_jobs1 (50/50) | 4,604 | 7,440(+61.6%) | 7,409(+60.9%) | 4,592 | 7,436(+61.9%) | 7,360(+60.3%) |
| 4k_qd1_jobs2 (70/30) | 11,813 | 17,238(+45.9%) | 23,612(+99.9%) | 5,060 | 7,397(+46.2%) | 10,156(+100.7%) |
| 4k_qd2_jobs1 (70/30) | 11,801 | 17,702(+50.0%) | 17,799(+50.8%) | 5,059 | 7,580(+49.8%) | 7,635(+50.9%) |
| 4k_qd2_jobs2 (70/30) | 19,999 | 33,621(+68.1%) | 18,931(-5.3%) | 8,566 | 14,407(+68.2%) | 8,106(-5.4%) |
| 4k_qd4_jobs2 (70/30) | 19,999 | 60,176(+200.9%) | 43,084(+115.4%) | 8,562 | 25,811(+201.5%) | 18,450(+115.5%) |
What stands out immediately in these results: At qd1, the queue depth that best reflects real-world web and database workloads, Provider C delivers the highest raw IOPS. If IOPS were the only metric that mattered, Provider C would appear to be the strongest performer in this scenario.
Provider A shows a clear IOPS ceiling. 19,999 IOPS was hit 5 times (see raw numbers below) across multiple tests, flattening out at the same throughput regardless of queue depth or job count. That kind of behavior strongly suggests an enforced limit rather than a hardware constraint.
Provider B scales linearly past 60,000 IOPS, and Provider C reaches around 43,000. But even those gains are irrelevant for typical web workloads. Your PHP script doesn’t care if the disk can handle 100,000 parallel operations; it cares how fast the one operation it’s waiting on will complete.
p99.9 Latency Comparison
Here’s the comparison for realistic VPS workloads (4K block size, low queue depth):
| p99.9 Test | Provider A Read |
Provider B Read |
Provider C Read |
Provider A Write |
Provider B Write |
Provider C Write |
|---|---|---|---|---|---|---|
| 4k_qd1_jobs1 (70/30) | 0.268ms | 0.157ms(-41.4%) | 0.561ms(+109.3%) | 0.214ms | 0.089ms(-58.4%) | 0.831ms(+288.3%) |
| 4k_qd1_jobs1 (50/50) | 0.218ms | 0.198ms(-9.2%) | 0.177ms(-18.8%) | 0.148ms | 0.095ms(-35.8%) | 0.076ms(-48.6%) |
| 4k_qd1_jobs2 (70/30) | 0.234ms | 0.214ms(-8.5%) | 0.177ms(-24.4%) | 0.183ms | 0.098ms(-46.4%) | 0.102ms(-44.3%) |
| 4k_qd2_jobs1 (70/30) | 0.226ms | 0.210ms(-7.1%) | 0.618ms(+173.5%) | 0.179ms | 0.096ms(-46.4%) | 0.643ms(+259.2%) |
| 4k_qd2_jobs2 (70/30) | 0.285ms | 0.259ms(-9.1%) | 1.012ms(+255.1%) | 0.214ms | 0.114ms(-46.7%) | 1.090ms(+409.3%) |
| 4k_qd4_jobs2 (70/30) | 0.522ms | 0.309ms(-40.8%) | 0.905ms(+73.4%) | 0.272ms | 0.155ms(-43.0%) | 1.106ms(+306.6%) |
What stands out immediately in these results is how differently each provider behaves under the same low-queue workloads.
While Provider C in the previous test posted the highest IOPS numbers, its p99.9 latency is wildly inconsistent, frequently spiking hundreds of percent above the others. This is a classic sign of an overprovisioned storage backend: too many noisy neighbors, uneven contention on the underlying node, or aggressive caching that collapses under certain access patterns.
In practical terms, this means that even though Provider C “wins” on IOPS, it loses where it matters most. The disk is slower far more often than it is faster. If you only looked at IOPS, Provider C would appear to be the best choice. The latency data shows why that conclusion would be wrong.
At qd1/jobs1 (the most realistic single-threaded workload), Provider B delivered 0.157ms p99.9 read latency versus Provider A’s 0.268ms (about 41% lower). Provider C lagged behind at 0.561ms, over 2× slower than Provider A and 3.5× slower than Provider B.
For writes, Provider B came in at 0.089ms versus 0.214ms for Provider A (over 2× faster), whereas Provider C’s p99.9 write was 0.831ms (nearly 4× slower than Provider A and over 9× slower than Provider B).
Visualizing How IOPS Can Be Misleading
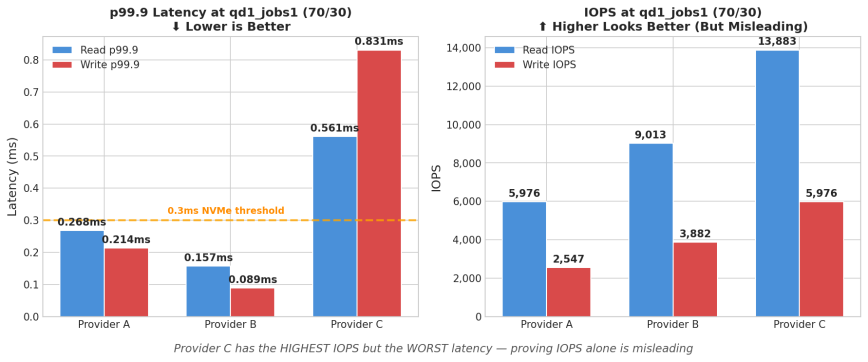
The charts below make the disconnect between IOPS and latency hard to ignore.
Key Takeaways
In the graph on the left, the orange line marks 0.3ms, a reasonable threshold for NVMe-class responsiveness at qd1. Provider B clears it easily. Provider A hovers near it. Provider C blows past it, with read latency ~2× slower and write latency ~3× over the threshold.
The graph on the right shows the most realistic workload (qd1_jobs1, read/write), Provider C posts the highest IOPS of all three providers. Yet it delivers the worst latency by a wide margin. If you selected a VPS based on IOPS alone, Provider C would win. However, in practice, it would feel the slowest.
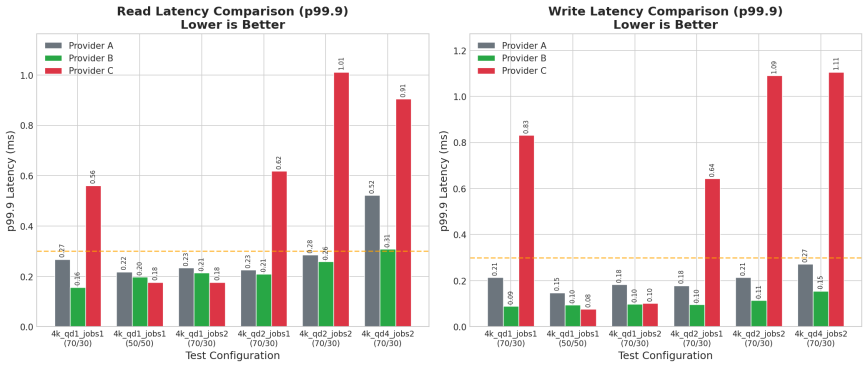
Full Latency Breakdown
Across all test configurations, Provider B (green) consistently delivers the lowest p99.9 latency. Provider C (red) shows erratic behavior. It’s sometimes competitive, but often far worse. This inconsistency is a red flag: it suggests noisy neighbors, inconsistent storage backends, or aggressive caching that falls apart under certain access patterns.
Notice how Provider C’s latency spikes at qd2 and above while Provider B stays flat. For typical VPS workloads that rarely exceed qd1-2, Provider B’s consistency matters more than Provider C’s occasional good results.
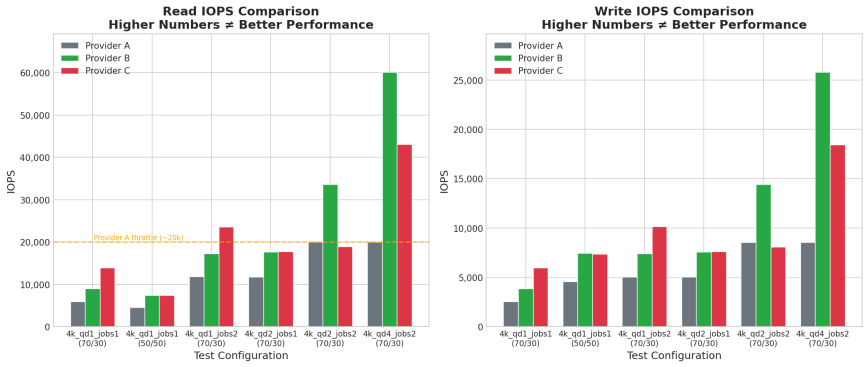
The IOPS Breakdown
As mentioned earlier, provider A’s IOPS flatlines at ~20,000, very likely throttled. Provider B scales to 60,000+. Provider C lands somewhere in between, reaching ~43,000 at qd4. But here’s the point: none of these IOPS differences fully predict user experience.
Provider C’s IOPS advantage at low queue depths (qd1_jobs1) didn’t translate to better latency. It translated to worse latency. The storage that “won” the IOPS benchmark lost the latency benchmark, and latency is what your users actually feel.
What to Benchmark Instead
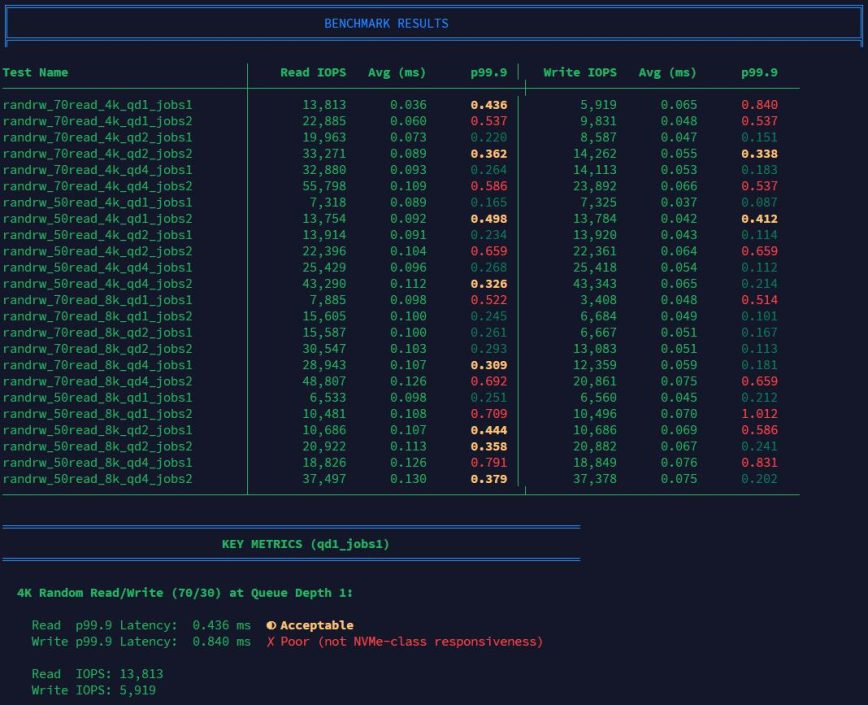
If you want to know how your VPS will actually perform, do not stop at marketing IOPS. Run fio at queue depth 1 with a single job and look at p99.9 latency:
fio --name=randrw --ioengine=libaio --iodepth=1 --rw=randrw --rwmixread=70 --bs=4k --direct=1 --size=2G --numjobs=1 --runtime=60 --group_reporting --output-format=json
Look at the clat (completion latency) percentiles in the JSON output. If your provider’s “NVMe” storage shows p99.9 latency above 0.3ms at qd1, you’re not getting NVMe-class responsiveness – regardless of what the spec sheet says.
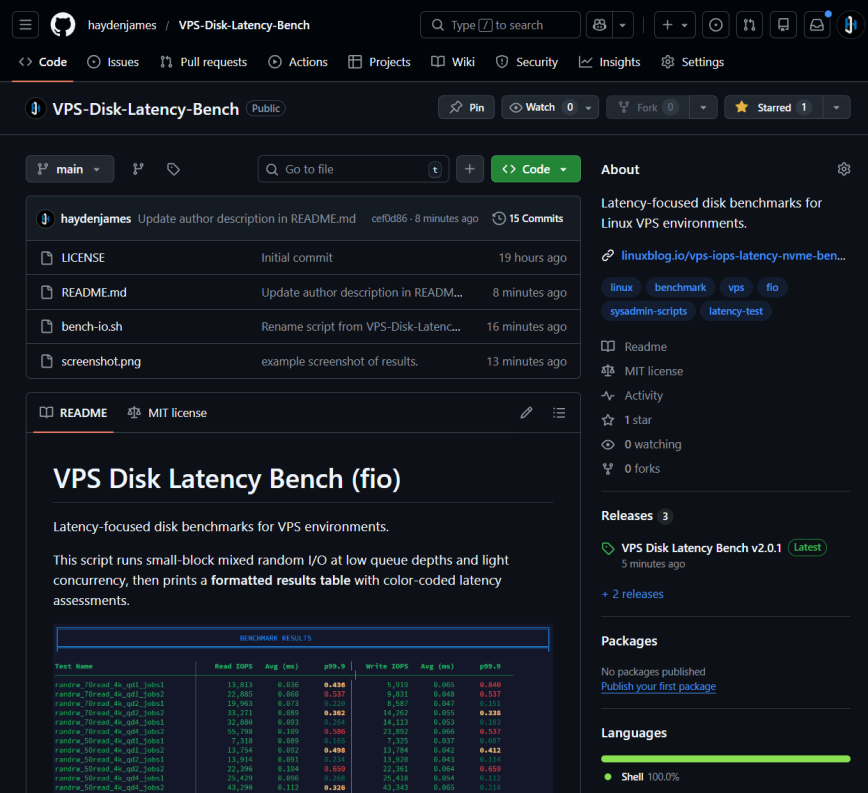
Note, I’ve uploaded this free script to GitHub: https://github.com/haydenjames/VPS-Disk-Latency-Bench/
The RAW test numbers
This section contains the unfiltered benchmark results exactly as they were recorded during testing. No normalization, averaging, or selective pruning has been applied. These raw numbers are included for transparency and for readers who want to inspect the underlying behavior beyond summaries and charts.
Provider A
File: /var/tmp/fio-vps-bench-20260202T153705Z.dat (2GiB)
randrw_70read_4k_qd1_jobs1 | read IOPS: 5976.400787 avg(ms): 0.119 p99.9(ms): 0.268 || write IOPS: 2546.548448 avg(ms): 0.078 p99.9(ms): 0.214
randrw_70read_4k_qd1_jobs2 | read IOPS: 11813.339555 avg(ms): 0.120 p99.9(ms): 0.234 || write IOPS: 5060.164661 avg(ms): 0.082 p99.9(ms): 0.183
randrw_70read_4k_qd2_jobs1 | read IOPS: 11801.173294 avg(ms): 0.121 p99.9(ms): 0.226 || write IOPS: 5058.898037 avg(ms): 0.084 p99.9(ms): 0.179
randrw_70read_4k_qd2_jobs2 | read IOPS: 19999.333356 avg(ms): 0.151 p99.9(ms): 0.285 || write IOPS: 8566.214460 avg(ms): 0.086 p99.9(ms): 0.214
randrw_70read_4k_qd4_jobs1 | read IOPS: 19999.266691 avg(ms): 0.149 p99.9(ms): 0.297 || write IOPS: 8587.947068 avg(ms): 0.093 p99.9(ms): 0.239
randrw_70read_4k_qd4_jobs2 | read IOPS: 19999.333356 avg(ms): 0.353 p99.9(ms): 0.522 || write IOPS: 8562.047932 avg(ms): 0.082 p99.9(ms): 0.272
randrw_50read_4k_qd1_jobs1 | read IOPS: 4604.079864 avg(ms): 0.120 p99.9(ms): 0.218 || write IOPS: 4592.246925 avg(ms): 0.077 p99.9(ms): 0.148
randrw_50read_4k_qd1_jobs2 | read IOPS: 8900.936635 avg(ms): 0.123 p99.9(ms): 0.264 || write IOPS: 8890.970301 avg(ms): 0.082 p99.9(ms): 0.169
randrw_50read_4k_qd2_jobs1 | read IOPS: 9079.830672 avg(ms): 0.120 p99.9(ms): 0.234 || write IOPS: 9087.963735 avg(ms): 0.082 p99.9(ms): 0.173
randrw_50read_4k_qd2_jobs2 | read IOPS: 16488.783707 avg(ms): 0.132 p99.9(ms): 0.281 || write IOPS: 16534.848838 avg(ms): 0.093 p99.9(ms): 0.212
randrw_50read_4k_qd4_jobs1 | read IOPS: 14890.236992 avg(ms): 0.152 p99.9(ms): 2.179 || write IOPS: 14867.037765 avg(ms): 0.102 p99.9(ms): 0.228
randrw_50read_4k_qd4_jobs2 | read IOPS: 19985.900470 avg(ms): 0.169 p99.9(ms): 0.465 || write IOPS: 20000.033332 avg(ms): 0.216 p99.9(ms): 0.449
randrw_70read_8k_qd1_jobs1 | read IOPS: 5309.923003 avg(ms): 0.139 p99.9(ms): 1.827 || write IOPS: 2271.957601 avg(ms): 0.080 p99.9(ms): 0.171
randrw_70read_8k_qd1_jobs2 | read IOPS: 11140.195327 avg(ms): 0.129 p99.9(ms): 0.259 || write IOPS: 4774.540849 avg(ms): 0.085 p99.9(ms): 0.185
randrw_70read_8k_qd2_jobs1 | read IOPS: 11124.095863 avg(ms): 0.129 p99.9(ms): 0.245 || write IOPS: 4771.540949 avg(ms): 0.087 p99.9(ms): 0.173
randrw_70read_8k_qd2_jobs2 | read IOPS: 20041.298623 avg(ms): 0.146 p99.9(ms): 0.322 || write IOPS: 8556.148128 avg(ms): 0.096 p99.9(ms): 0.272
randrw_70read_8k_qd4_jobs1 | read IOPS: 19999.833339 avg(ms): 0.145 p99.9(ms): 0.301 || write IOPS: 8535.415486 avg(ms): 0.103 p99.9(ms): 0.239
randrw_70read_8k_qd4_jobs2 | read IOPS: 19999.400020 avg(ms): 0.350 p99.9(ms): 0.537 || write IOPS: 8582.847238 avg(ms): 0.087 p99.9(ms): 0.285
randrw_50read_8k_qd1_jobs1 | read IOPS: 4334.155528 avg(ms): 0.128 p99.9(ms): 0.259 || write IOPS: 4307.989734 avg(ms): 0.081 p99.9(ms): 0.171
randrw_50read_8k_qd1_jobs2 | read IOPS: 8377.187427 avg(ms): 0.132 p99.9(ms): 0.285 || write IOPS: 8382.620579 avg(ms): 0.086 p99.9(ms): 0.194
randrw_50read_8k_qd2_jobs1 | read IOPS: 8345.955135 avg(ms): 0.132 p99.9(ms): 0.293 || write IOPS: 8358.954702 avg(ms): 0.089 p99.9(ms): 0.191
randrw_50read_8k_qd2_jobs2 | read IOPS: 15295.756808 avg(ms): 0.144 p99.9(ms): 0.326 || write IOPS: 15322.222593 avg(ms): 0.100 p99.9(ms): 0.228
randrw_50read_8k_qd4_jobs1 | read IOPS: 14789.107030 avg(ms): 0.148 p99.9(ms): 0.322 || write IOPS: 14797.840072 avg(ms): 0.107 p99.9(ms): 0.222
randrw_50read_8k_qd4_jobs2 | read IOPS: 19986.433786 avg(ms): 0.169 p99.9(ms): 0.424 || write IOPS: 19998.800040 avg(ms): 0.216 p99.9(ms): 0.453
Provider B
File: /home/tmp/fio-vps-bench-20260202T181703Z.dat (2GiB)
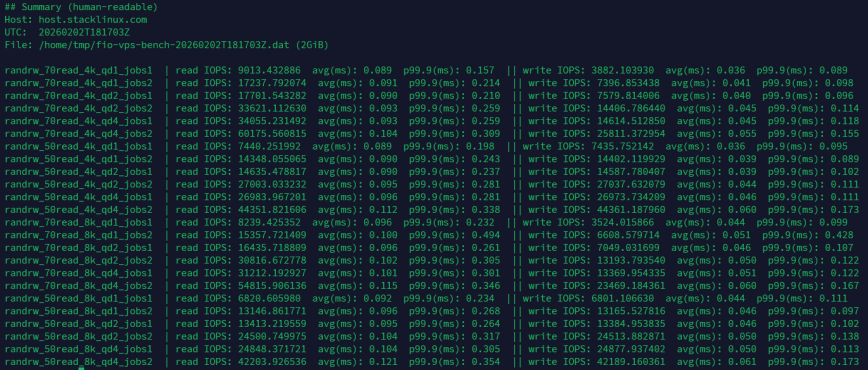
randrw_70read_4k_qd1_jobs1 | read IOPS: 9013.432886 avg(ms): 0.089 p99.9(ms): 0.157 || write IOPS: 3882.103930 avg(ms): 0.036 p99.9(ms): 0.089
randrw_70read_4k_qd1_jobs2 | read IOPS: 17237.792074 avg(ms): 0.091 p99.9(ms): 0.214 || write IOPS: 7396.853438 avg(ms): 0.041 p99.9(ms): 0.098
randrw_70read_4k_qd2_jobs1 | read IOPS: 17701.543282 avg(ms): 0.090 p99.9(ms): 0.210 || write IOPS: 7579.814006 avg(ms): 0.040 p99.9(ms): 0.096
randrw_70read_4k_qd2_jobs2 | read IOPS: 33621.112630 avg(ms): 0.093 p99.9(ms): 0.259 || write IOPS: 14406.786440 avg(ms): 0.045 p99.9(ms): 0.114
randrw_70read_4k_qd4_jobs1 | read IOPS: 34055.231492 avg(ms): 0.093 p99.9(ms): 0.259 || write IOPS: 14614.512850 avg(ms): 0.045 p99.9(ms): 0.118
randrw_70read_4k_qd4_jobs2 | read IOPS: 60175.560815 avg(ms): 0.104 p99.9(ms): 0.309 || write IOPS: 25811.372954 avg(ms): 0.055 p99.9(ms): 0.155
randrw_50read_4k_qd1_jobs1 | read IOPS: 7440.251992 avg(ms): 0.089 p99.9(ms): 0.198 || write IOPS: 7435.752142 avg(ms): 0.036 p99.9(ms): 0.095
randrw_50read_4k_qd1_jobs2 | read IOPS: 14348.055065 avg(ms): 0.090 p99.9(ms): 0.243 || write IOPS: 14402.119929 avg(ms): 0.039 p99.9(ms): 0.089
randrw_50read_4k_qd2_jobs1 | read IOPS: 14635.478817 avg(ms): 0.090 p99.9(ms): 0.237 || write IOPS: 14587.780407 avg(ms): 0.039 p99.9(ms): 0.102
randrw_50read_4k_qd2_jobs2 | read IOPS: 27003.033232 avg(ms): 0.095 p99.9(ms): 0.281 || write IOPS: 27037.632079 avg(ms): 0.044 p99.9(ms): 0.111
randrw_50read_4k_qd4_jobs1 | read IOPS: 26983.967201 avg(ms): 0.096 p99.9(ms): 0.281 || write IOPS: 26973.734209 avg(ms): 0.046 p99.9(ms): 0.111
randrw_50read_4k_qd4_jobs2 | read IOPS: 44351.821606 avg(ms): 0.112 p99.9(ms): 0.338 || write IOPS: 44361.187960 avg(ms): 0.060 p99.9(ms): 0.173
randrw_70read_8k_qd1_jobs1 | read IOPS: 8239.425352 avg(ms): 0.096 p99.9(ms): 0.232 || write IOPS: 3524.015866 avg(ms): 0.044 p99.9(ms): 0.099
randrw_70read_8k_qd1_jobs2 | read IOPS: 15357.721409 avg(ms): 0.100 p99.9(ms): 0.494 || write IOPS: 6608.579714 avg(ms): 0.051 p99.9(ms): 0.428
randrw_70read_8k_qd2_jobs1 | read IOPS: 16435.718809 avg(ms): 0.096 p99.9(ms): 0.261 || write IOPS: 7049.031699 avg(ms): 0.046 p99.9(ms): 0.107
randrw_70read_8k_qd2_jobs2 | read IOPS: 30816.672778 avg(ms): 0.102 p99.9(ms): 0.305 || write IOPS: 13193.793540 avg(ms): 0.050 p99.9(ms): 0.122
randrw_70read_8k_qd4_jobs1 | read IOPS: 31212.192927 avg(ms): 0.101 p99.9(ms): 0.301 || write IOPS: 13369.954335 avg(ms): 0.051 p99.9(ms): 0.122
randrw_70read_8k_qd4_jobs2 | read IOPS: 54815.906136 avg(ms): 0.115 p99.9(ms): 0.346 || write IOPS: 23469.184361 avg(ms): 0.060 p99.9(ms): 0.167
randrw_50read_8k_qd1_jobs1 | read IOPS: 6820.605980 avg(ms): 0.092 p99.9(ms): 0.234 || write IOPS: 6801.106630 avg(ms): 0.044 p99.9(ms): 0.111
randrw_50read_8k_qd1_jobs2 | read IOPS: 13146.861771 avg(ms): 0.096 p99.9(ms): 0.268 || write IOPS: 13165.527816 avg(ms): 0.046 p99.9(ms): 0.097
randrw_50read_8k_qd2_jobs1 | read IOPS: 13413.219559 avg(ms): 0.095 p99.9(ms): 0.264 || write IOPS: 13384.953835 avg(ms): 0.046 p99.9(ms): 0.102
randrw_50read_8k_qd2_jobs2 | read IOPS: 24500.749975 avg(ms): 0.104 p99.9(ms): 0.317 || write IOPS: 24513.882871 avg(ms): 0.050 p99.9(ms): 0.138
randrw_50read_8k_qd4_jobs1 | read IOPS: 24848.371721 avg(ms): 0.104 p99.9(ms): 0.305 || write IOPS: 24877.937402 avg(ms): 0.050 p99.9(ms): 0.113
randrw_50read_8k_qd4_jobs2 | read IOPS: 42203.926536 avg(ms): 0.121 p99.9(ms): 0.354 || write IOPS: 42189.160361 avg(ms): 0.061 p99.9(ms): 0.173
Provider C
File: /var/tmp/fio-bench-20260203T003025Z.dat (2GiB)
randrw_70read_4k_qd1_jobs1 | read IOPS: 13882.937235 avg(ms): 0.038 p99.9(ms): 0.561 || write IOPS: 5976.167461 avg(ms): 0.058 p99.9(ms): 0.831
randrw_70read_4k_qd1_jobs2 | read IOPS: 23612.046265 avg(ms): 0.058 p99.9(ms): 0.177 || write IOPS: 10155.894804 avg(ms): 0.045 p99.9(ms): 0.102
randrw_70read_4k_qd2_jobs1 | read IOPS: 17799.373354 avg(ms): 0.080 p99.9(ms): 0.618 || write IOPS: 7634.878837 avg(ms): 0.055 p99.9(ms): 0.643
randrw_70read_4k_qd2_jobs2 | read IOPS: 18930.835639 avg(ms): 0.146 p99.9(ms): 1.012 || write IOPS: 8106.463118 avg(ms): 0.122 p99.9(ms): 1.090
randrw_70read_4k_qd4_jobs1 | read IOPS: 24075.297490 avg(ms): 0.120 p99.9(ms): 0.782 || write IOPS: 10336.055465 avg(ms): 0.087 p99.9(ms): 0.823
randrw_70read_4k_qd4_jobs2 | read IOPS: 43083.530549 avg(ms): 0.132 p99.9(ms): 0.905 || write IOPS: 18450.118329 avg(ms): 0.107 p99.9(ms): 1.106
randrw_50read_4k_qd1_jobs1 | read IOPS: 7408.886370 avg(ms): 0.088 p99.9(ms): 0.177 || write IOPS: 7359.621346 avg(ms): 0.037 p99.9(ms): 0.076
randrw_50read_4k_qd1_jobs2 | read IOPS: 11887.837072 avg(ms): 0.102 p99.9(ms): 0.782 || write IOPS: 11935.002167 avg(ms): 0.052 p99.9(ms): 0.750
randrw_50read_4k_qd2_jobs1 | read IOPS: 12091.430286 avg(ms): 0.101 p99.9(ms): 0.676 || write IOPS: 12073.430886 avg(ms): 0.052 p99.9(ms): 0.659
randrw_50read_4k_qd2_jobs2 | read IOPS: 25986.033799 avg(ms): 0.096 p99.9(ms): 0.272 || write IOPS: 26004.233192 avg(ms): 0.049 p99.9(ms): 0.109
randrw_50read_4k_qd4_jobs1 | read IOPS: 23716.476117 avg(ms): 0.104 p99.9(ms): 0.651 || write IOPS: 23735.575481 avg(ms): 0.056 p99.9(ms): 0.610
randrw_50read_4k_qd4_jobs2 | read IOPS: 40446.818439 avg(ms): 0.116 p99.9(ms): 0.610 || write IOPS: 40453.518216 avg(ms): 0.074 p99.9(ms): 0.627
randrw_70read_8k_qd1_jobs1 | read IOPS: 6659.844672 avg(ms): 0.111 p99.9(ms): 0.692 || write IOPS: 2842.471918 avg(ms): 0.063 p99.9(ms): 1.036
randrw_70read_8k_qd1_jobs2 | read IOPS: 12433.185560 avg(ms): 0.120 p99.9(ms): 0.848 || write IOPS: 5325.755808 avg(ms): 0.070 p99.9(ms): 0.922
randrw_70read_8k_qd2_jobs1 | read IOPS: 15099.396687 avg(ms): 0.102 p99.9(ms): 0.289 || write IOPS: 6449.418353 avg(ms): 0.054 p99.9(ms): 0.237
randrw_70read_8k_qd2_jobs2 | read IOPS: 20039.565348 avg(ms): 0.141 p99.9(ms): 1.028 || write IOPS: 8561.714610 avg(ms): 0.110 p99.9(ms): 1.417
randrw_70read_8k_qd4_jobs1 | read IOPS: 25358.988034 avg(ms): 0.119 p99.9(ms): 0.700 || write IOPS: 10848.205060 avg(ms): 0.073 p99.9(ms): 0.709
randrw_70read_8k_qd4_jobs2 | read IOPS: 42216.626112 avg(ms): 0.142 p99.9(ms): 0.848 || write IOPS: 18043.331889 avg(ms): 0.094 p99.9(ms): 0.831
randrw_50read_8k_qd1_jobs1 | read IOPS: 5353.154895 avg(ms): 0.109 p99.9(ms): 0.676 || write IOPS: 5367.021099 avg(ms): 0.061 p99.9(ms): 0.971
randrw_50read_8k_qd1_jobs2 | read IOPS: 12420.752642 avg(ms): 0.101 p99.9(ms): 0.264 || write IOPS: 12459.718009 avg(ms): 0.049 p99.9(ms): 0.098
randrw_50read_8k_qd2_jobs1 | read IOPS: 11962.067931 avg(ms): 0.101 p99.9(ms): 0.276 || write IOPS: 11910.102997 avg(ms): 0.056 p99.9(ms): 0.122
randrw_50read_8k_qd2_jobs2 | read IOPS: 18600.213326 avg(ms): 0.127 p99.9(ms): 0.823 || write IOPS: 18610.746308 avg(ms): 0.075 p99.9(ms): 0.799
randrw_50read_8k_qd4_jobs1 | read IOPS: 19291.990267 avg(ms): 0.124 p99.9(ms): 0.750 || write IOPS: 19317.822739 avg(ms): 0.073 p99.9(ms): 0.741
randrw_50read_8k_qd4_jobs2 | read IOPS: 37913.969534 avg(ms): 0.129 p99.9(ms): 0.375 || write IOPS: 37876.270791 avg(ms): 0.074 p99.9(ms): 0.216
Conclusion
NVMe benchmarks are often misleading because they measure the wrong thing. High IOPS numbers come from tests designed to saturate storage with parallel requests, not from conditions that reflect how web servers, databases, or applications actually operate.
Real workloads are latency-bound. A single PHP request waiting on MySQL does not meaningfully benefit from 100,000 IOPS if each operation still takes milliseconds to complete. It benefits from sub-millisecond completion times on individual operations. That is where p99.9 latency at low queue depth tells the truth that IOPS numbers hide.
The benchmark results here show a 41% improvement in read latency and over 2× improvement in write latency when comparing the best performer (Provider B) to the baseline (Provider A). Provider C demonstrates the danger of IOPS-focused comparisons: it posted the highest IOPS numbers at qd1 yet delivered the worst latency. Differences in latency directly translate to faster page loads, snappier database queries, and more responsive applications. None of that shows up in an IOPS comparison.
Next time you evaluate a VPS, run fio at qd1, check p99.9 latency, and see what you’re actually getting. Latency is what your users feel. IOPS is what marketing sells.
Full disclosure: Provider B is StackLinux, which I own and operate. It is included to demonstrate how properly tuned NVMe storage behaves under low-queue workloads. This article focuses on IOPS versus latency and not host rankings.
