systemd-analyze: Debug and Optimize Your Linux Boot Time
If your Linux system takes longer to boot than you think it should, the answer is almost certainly hiding in your systemd startup chain. The good news: systemd already ships with everything you need to find the problem and fix it. No extra tools required, no guesswork.
In this guide, you will use systemd-analyze to break down your boot time, identify the slowest services, visualize the dependency chain, validate unit files, and map the full dependency graph. By the end, you will know exactly where your boot time is going and how to get it back.
What is systemd-analyze?
systemd-analyze is a built-in systemd tool that lets you inspect and debug the boot process on any Linux system running systemd. It shows you how long each unit took to initialize, where time is being wasted, and gives you a clear picture of the boot chain. If your server or desktop takes longer to boot than it should, this is where you start.
It ships with systemd, so no installation is needed. If you are running a modern Debian, Ubuntu, Fedora, Arch, or RHEL-based system, you already have it.
Basic Usage: How Long Did Boot Take?
Run this first to get a high-level summary:
systemd-analyze
Example output:
Startup finished in 3.271s (firmware) + 1.203s (loader) + 2.817s (kernel) + 8.431s (userspace) = 15.722s
graphical.target reached after 8.218s in userspace
This breaks the boot into four phases:
- firmware: Time spent in UEFI/BIOS before the bootloader starts
- loader: Time GRUB or systemd-boot spent loading the kernel
- kernel: Time from kernel start until the first userspace process
- userspace: Time from init to the target being reached
On a server, you usually cannot do much about firmware or loader time, but userspace is almost always where slowdowns live and where you have direct control.
Blame: Find the Slowest Units
The blame subcommand lists all started units sorted by the time they took to initialize:
systemd-analyze blame
Example output (truncated):
7.431s NetworkManager-wait-online.service
4.203s plymouth-quit-wait.service
2.871s apt-daily-upgrade.service
1.203s dev-sda1.device
 941ms ModemManager.service
 812ms snapd.service
 701ms udisks2.service
 488ms avahi-daemon.service
 312ms systemd-udev-settle.service
Read this list from top to bottom. The units at the top are your biggest offenders. Common culprits include NetworkManager-wait-online.service, which blocks boot until a network connection is fully established, and plymouth-quit-wait.service, which waits for the splash screen animation to finish.
Critical Chain: Visualize the Boot Path
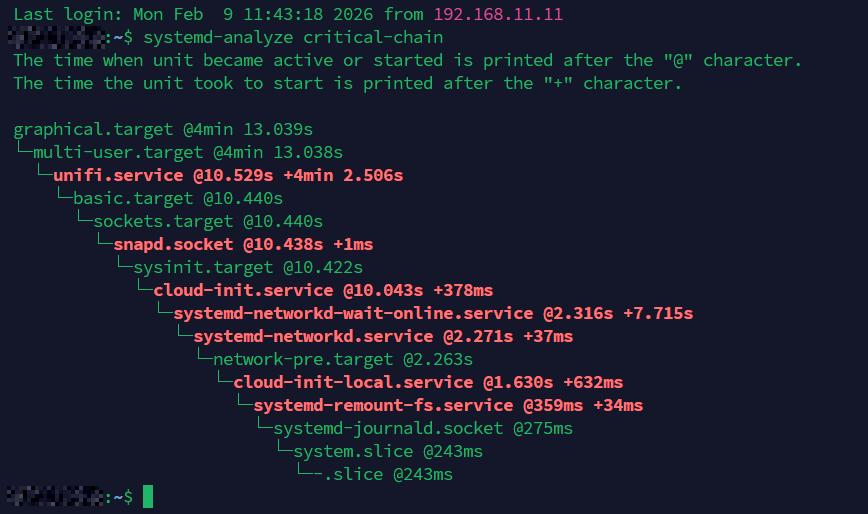
The blame output shows total time per unit, but it does not tell you which units were blocking others. For that, use critical-chain:
systemd-analyze critical-chain
Example output:
graphical.target @8.218s
└─multi-user.target @8.217s
  └─nginx.service @7.891s +325ms
    └─network-online.target @7.889s
      └─NetworkManager-wait-online.service @0.458s +7.431s
        └─NetworkManager.service @0.412s +45ms
          └─basic.target @0.401s
            └─sockets.target @0.401s
              └─snapd.socket @0.398s +2ms
This shows the dependency chain that determined your boot time. The @ timestamp is when the unit started, and + is how long it took. In this example, NetworkManager-wait-online.service is the clear bottleneck, holding up everything above it for over 7 seconds.
You can also inspect the critical chain for a specific target:
systemd-analyze critical-chain multi-user.target
Generate a Boot Chart (SVG)
For a visual overview, generate an SVG chart of the entire boot process:
systemd-analyze plot > boot-chart.svg
Open boot-chart.svg in a browser. It shows every unit on a timeline with color-coded bars for activating, active, and deactivating states. This is especially useful when you need to present boot performance data or compare before and after results.
Common Fixes for Slow Boot
Once you have identified the slow units, here are the most common fixes.
Disable NetworkManager-wait-online
This service is rarely needed on desktops and only useful on servers where services require a fully configured network at boot. On most systems, NetworkManager will bring the network up regardless. Disable the wait:
sudo systemctl disable NetworkManager-wait-online.service
Alternatively, mask it to prevent other units from pulling it in:
sudo systemctl mask NetworkManager-wait-online.service
Remove or Disable Unused Services
Review the blame output for services you do not use. Common candidates on desktops include ModemManager.service (unless you use a mobile broadband modem), bluetooth.service (if you do not use Bluetooth), and cups.service (if you do not print).
sudo systemctl disable ModemManager.service
sudo systemctl disable bluetooth.service
On servers, check for services left over from the default install. Tools like snapd, avahi-daemon, and packagekit are often unnecessary. For a deeper guide on cleaning up unnecessary services, see What’s Next After Installation.
Remove Snap (If Unused)
The snapd service and its socket add measurable boot overhead on Ubuntu. If you do not use Snap packages, removing it entirely is a clean fix. See the full walkthrough in Remove Snap Ubuntu 22.04 LTS and 24.04 LTS.
Switch to a Faster Plymouth Theme (or Disable It)
On desktops, plymouth-quit-wait.service can add several seconds. If you do not need a graphical splash screen:
sudo systemctl disable plymouth-quit-wait.service
sudo systemctl disable plymouth-read-write.service
Or switch to a simple text theme which finishes faster:
sudo plymouth-set-default-theme details
sudo update-initramfs -u
Audit Service Security with verify
While debugging boot, you can also audit the security posture of your services using systemd-analyze security:
systemd-analyze security
This prints a table of all running services with an exposure score from 0.0 (fully sandboxed) to 10.0 (no restrictions). Focus on services exposed to the network first. To inspect a specific unit in detail:
systemd-analyze security nginx.service
This lists every sandboxing directive and whether it is enabled. It is a quick way to identify services that could benefit from additional hardening like ProtectSystem=, PrivateTmp=, or NoNewPrivileges=.
Verify Unit Files for Errors
A broken or misconfigured unit file can silently add seconds to your boot, or worse, cause a service to fail and stall the entire startup chain. The verify subcommand catches these problems before they bite you:
systemd-analyze verify nginx.service
This parses the unit file and checks for syntax errors, missing dependencies, invalid directives, and ordering cycles. If the file is clean, you get no output. If something is wrong, you get specific warnings:
nginx.service: Unit has a dependency cycle involving nginx.service
/etc/systemd/system/nginx.service:12: Unknown key name 'ExecStrat' in section 'Service', ignoring.
In that example, a typo (ExecStrat instead of ExecStart) would cause the service to fail silently on boot. The cycle warning points to a dependency loop that could block startup entirely.
You can also verify all system units at once by pointing it at your default boot target:
systemd-analyze verify default.target
This walks the full dependency tree and reports every issue it finds. Run it after editing any unit file or creating a new one. It takes a second and saves you a frustrating reboot cycle.
Map the Full Dependency Graph with dot
The critical-chain subcommand shows you the single longest path through your boot. That is useful, but it does not show you the full picture. Services that are not on the critical path can still pull in unnecessary dependencies, adding complexity and potential delays.
The dot subcommand generates a complete dependency graph in Graphviz DOT format:
systemd-analyze dot | dot -Tsvg -o dependencies.svg
This requires the graphviz package. Install it first if you do not have it:
sudo apt install graphviz
Open the resulting SVG in a browser. You will see every unit and every dependency relationship between them, color-coded by type. Green lines represent Requires= and Wants= dependencies, while red lines represent Conflicts= relationships.
On a typical desktop install, the full graph is dense. You can filter it down to a specific unit and its neighbors:
systemd-analyze dot nginx.service | dot -Tsvg -o nginx-deps.svg
This is particularly useful when a service is starting later than expected and you want to see what is pulling it in or what it is waiting on. Combined with critical-chain, it gives you both the zoomed-in and zoomed-out view of your boot.
Measure Before and After
Whenever you make boot optimizations, always measure the result. Reboot and run systemd-analyze again to compare total boot time. For a more detailed comparison, save the SVG chart before and after:
systemd-analyze plot > boot-before.svg
# Make your changes, reboot
systemd-analyze plot > boot-after.svg
This gives you concrete numbers instead of guesswork.
Quick Reference
systemd-analyze: Total boot time summarysystemd-analyze blame: Units sorted by init timesystemd-analyze critical-chain: Dependency chain causing the longest pathsystemd-analyze plot > boot.svg: Visual boot timelinesystemd-analyze security: Security audit of running servicessystemd-analyze verify foo.service: Check a unit file for errorssystemd-analyze dot | dot -Tsvg -o deps.svg: Full dependency graph (requires graphviz)
For a broader approach to tracking down performance issues beyond boot time, see Linux Troubleshooting: These 4 Steps Will Fix 99% of Errors. If your system feels sluggish after boot, Why Your Linux Server “Looks Idle” but “Feels” Slow covers the next layer of diagnostics.
